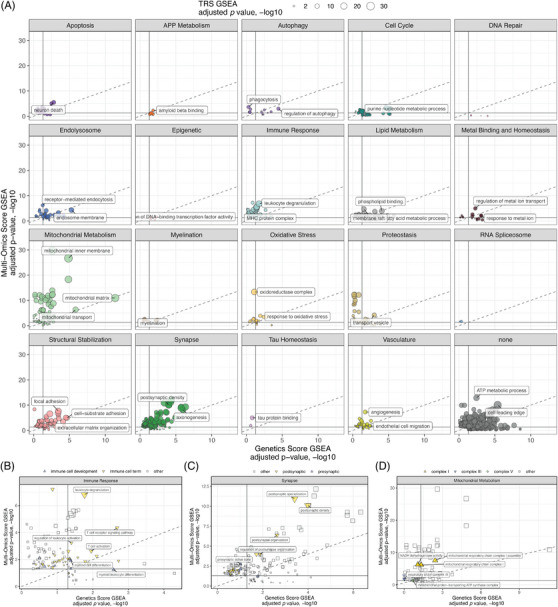
FIGURE 5.

Comparing biological domain enrichments across risk modalities. (A) Relative significance of biological domain term enrichment using genetics score component (x‐axis), multi‐omic score component (y‐axis), and the overall TRS (point size). (B) Term enrichments from Immune Response biological domain, subset by immune cell development terms (blue), other immune cell terms (yellow), and other terms from the Immune Response biological domain (gray). (C) Term enrichments from Synapse biological domain, subset by postsynaptic terms (yellow), presynaptic terms (blue), and other terms from the Synapse biological domain (gray). (D) Term enrichments from Mitochondrial Metabolism biological domain, subset by mitochondrial electron transport chain complex I (yellow), complex III (blue), complex V (green), and other terms from the Mitochondrial Metabolism biological domain (gray). Complexes II and IV were not significantly enriched in these analyses.
