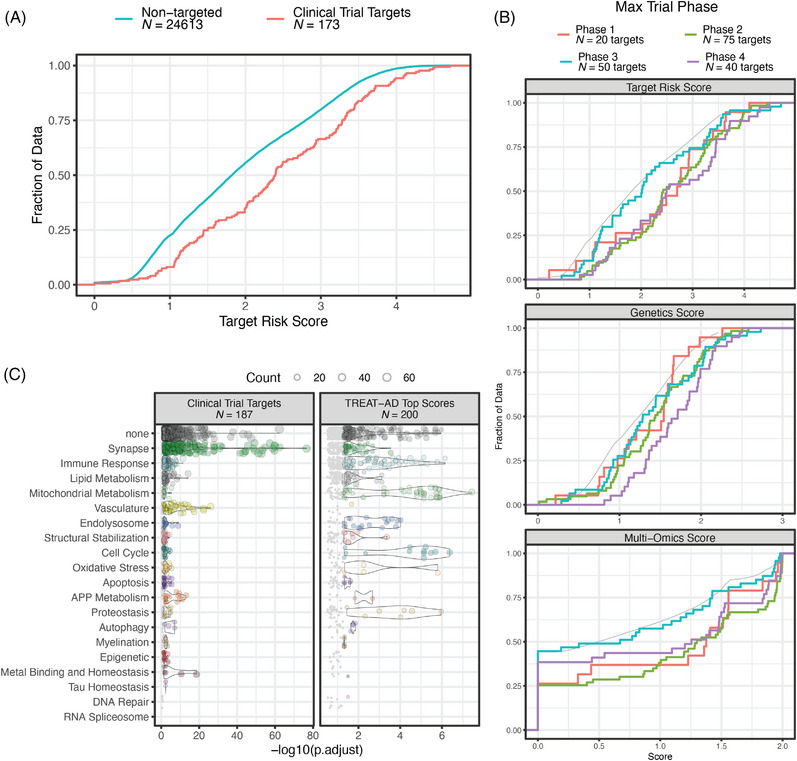
FIGURE 6.

Evaluation of targets of agents in clinical trials for AD. (A) Empirical cumulative distribution functions (ECDFs) of overall target risk score (TRS) for genes identified as targets of agents in clinical trials (red line) and genes that are not targeted by any trial therapeutic (blue line). (B) ECDFs of the TRSs and component risk scores for targets of agents in clinical trial, broken out by maximum clinical trial phase for each agent. For each plot the gray line represents the distribution of non‐targeted genes. The distribution of genetics scores for targets of agents that have reached phase 4 trials is significantly higher than the distributions of targets of agents in other phases of development (Kolmogorov–Smirnov p values from .04 to .0066). (C) Significantly enriched GO terms for targets of agents in clinical trials and a comparably sized set of genes from the top of the TRS distribution. Each point is a term within the indicated biological domain, the position on the x‐axis shows the significance of the term enrichment, and the size of the point is scaled by the number of genes in that term in the lists. The name and size of each list is indicated above each plot.
