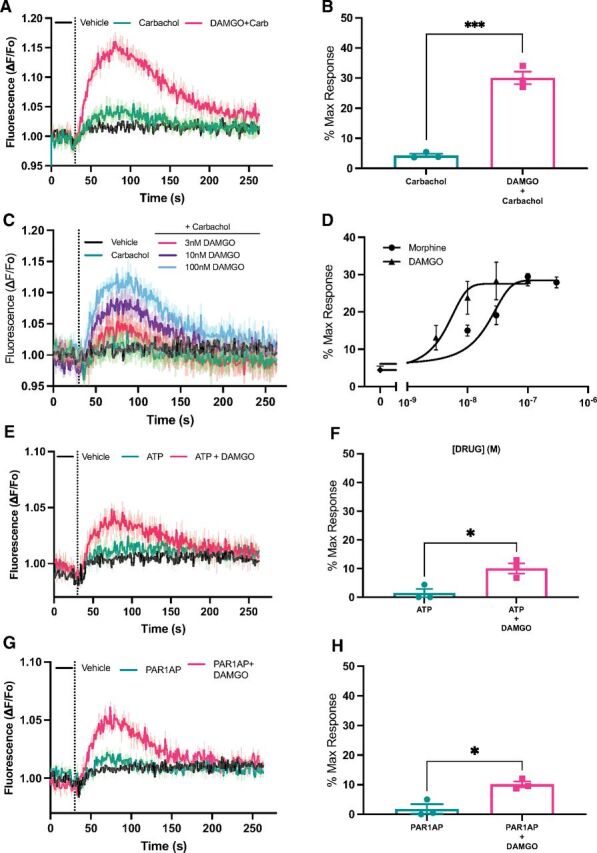
Fig. 3.

Gq synergy with MOR for PLC activation is independent of the nature of the stimulating Gq-coupled GPCR. (A) HEK cells stably expressing MOR and transduced with the DAG reporter without transduction of the M1 muscarinic receptor were treated with vehicle, 50 μM carbachol, or 50 μM carbachol + 100 nM DAMGO. Data are mean ± S.E.M. from 1 representative experiment. (B) Peak DAG production relative to maximum PDBu-dependent DAG production was calculated from 3 independent experiments each performed in 4 independent wells as in (A); unpaired t test t(4) = 12.03, P = 0.0003. (C) HEK293 cells stably expressing MOR were as in (A) treated with vehicle, 50 μM carbachol, or carbachol + varying concentrations of DAMGO. Representative traces from 1 experiment with 4 replicates each condition. (D) Peak DAG production at each concentration of agonist relative to maximum PDBu-dependent DAG production was calculated from 3 independent experiments each performed in 4 independent wells for each concentration. Nonlinear regression curve fitting: morphine EC50= 17 nM (95% CI, 7–27 nM) and DAMGO EC50= 3.8 nM (95% CI, 1.6–7.7 nM). (E) Experiments were performed as in (A) except 100 μM ATP instead of carbachol was used as the agonist for activation of Gq. Data are mean ± S.E.M. from 1 representative experiment. (F) Peak DAG production relative to maximum PDBu-dependent DAG production was calculated from 3 independent experiments each performed in 4 independent wells as in B; unpaired t test t(4) = 3.7, P = 0.02. (G) Experiments were performed as in (A) except 3 μM PAR-1 activating peptide (SSFLRN) was used as the agonist for activation of Gq. Data are mean ± S.E.M. from 1 representative experiment. (H) Peak DAG production relative to maximum PDBu-dependent DAG production was calculated from 3 independent experiments each performed in 4 independent wells as in B; unpaired t test t(4) = 4.45, P = 0.01. *P < 0.05, ***P < 0.0005.
