Fig. 4.
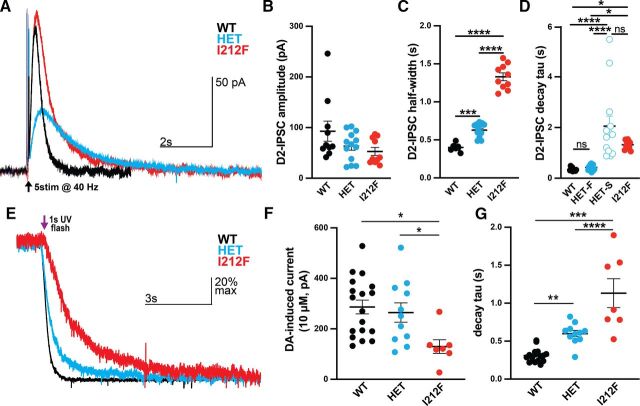
Prolonged signaling kinetics in midbrain dopamine neurons from Drd2I212F mice. (A) Representative recordings of D2-IPSCs elicited by five electrical pulses delivered at 40 Hz in midbrain slices from Drd2+/+ (WT, black), Drd2+/I212F (HET, cyan), and Drd2I212F/I212F (I212F, red) mice. (B) Average amplitude of D2-IPSCs elicited with five pulses in each genotype. (WT, 93 ± 20 pA; HET, 63 ± 8 pA; and I212F, 53 ± 8 pA; Kruskal-Wallis test, H = 2.93, P > 0.05). (C) Average width of the D2-IPSC measured at 50% of the peak (half width) (WT, 0.40 ± 0.01 seconds; HET, 0.63 ± 0.03 seconds; and I212F, 1.33 ± 0.05 seconds). (D) τ values obtained with either a single (WT, I212F) or double (HET) exponential fit. Drd2+/I212F mice displayed a two-component decay, with a fast component (HET-F) resembling Drd2+/+ and a slow component (HET-S) resembling τ values for Drd2I212F/I212F (WT, 0.3 ± 0.2 seconds; Het-F, 0.43 ± 0.03 seconds; Het-S, 2.1 ± 0.4 seconds; and I212F, 1.3 ± 0.1 seconds). (E) Normalized (scaled-to-peak) D2 currents terminated by photolytic release of sulpiride in Drd2+/+ (WT, black), Drd2+/I212F (HET, cyan), and Drd2I212F/I212F (I212F, red) animals. (F) Amplitude of the current induced by 10 µM dopamine across genotypes. Homozygous mutants displayed a significant decrease compared with both WT and heterozygous animals (WT, 287 ± 27 pA; HET, 264 ± 38 pA; I212F, 130 ± 27 pA. (G) Quantification of the decay τ following photolytic release of sulpiride. Homozygous mutants exhibit the slowest kinetics, with heterozygous animals showing an intermediate slowing effect compared with WT animals (WT, 310 ± 20 milliseconds; HET, 600 ± 42 milliseconds; I212F, 1132 ± 191 milliseconds). All values plotted are mean ± S.E.M. (B–D) N = 10 cells/3 mice (WT), 13 cells/4 mice (HET), and 10 cells/3 mice (I212F). (F and G) N = 18 cells/6 mice (WT), 11 cells/4 mice (HET), and 7 cells/4 mice (I212F). *P < 0.05; **P < 0.01; ***P < 0.001; ****P < 0.0001 using Dunn’s after Kruskal-Wallis or Tukey's after ANOVA. ns, not significant.

