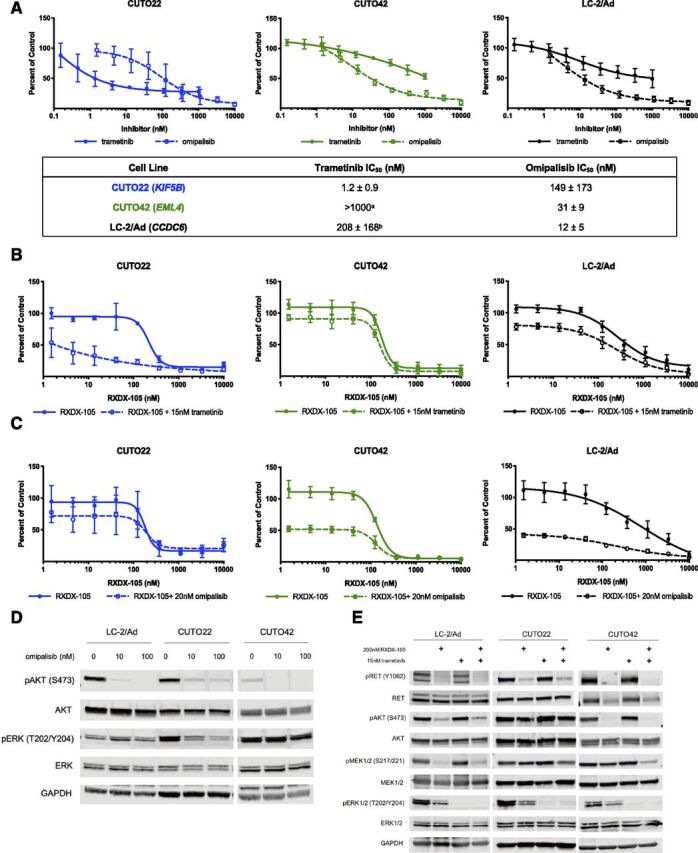
Fig 4.

RET+ cells have differential responses to MEK and PI3K inhibition. (A) MTS proliferation assays in CUTO22, CUTO42, and LC-2/Ad cells treated with increasing concentrations of trametinib or omipalisib. Lower table describes IC50 values ± S.D. Error bars represent means ± S.D. for three replicate experiments. MTS proliferations assays in CUTO22, CUTO32, CUTO42, or LC-2/Ad cells treated with increasing concentrations of RXDX-105 alone or in combination with 15 nM trametinib (B) or 20 nM omipalisib (C). Error bars represent means ± S.D. for three biologic replicate experiments. (D) Western blot analysis of cells treated with 10 or 100 nM omipalisib for 2 hours. (E) Western blot analysis of RET+ cell lines treated with RXDX-105, trametinib, or both for 2 hours. aIC50 not calculated because cells did not reach 50% inhibition of proliferation. bIC50 calculated from N = 2 replicates because third replicate did not reach 50% of proliferation.
