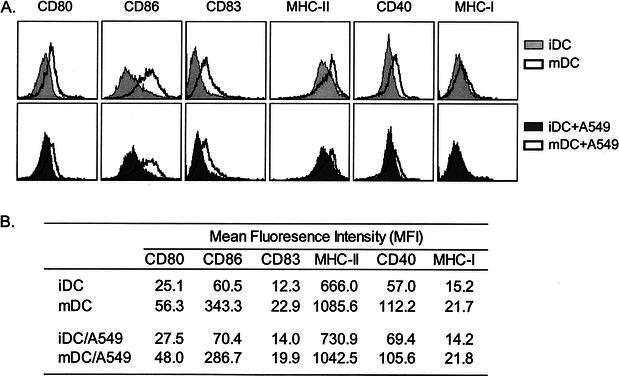
Fig. 3.

Cell surface phenotype of A549-loaded immature and mature DC. Immature DC were mixed with or without irradiated A549 cells for 24 h and then untreated or matured with BCG and IFNγ for an additional 24 h. Cells were analyzed by flow cytometry for expression of the indicated surface markers. A Histograms of various surface markers expressed by immature and mature DC with or without loading of A549 cells. B The corresponding mean fluorescence intensities of each surface marker. A representative experiment of three is shown
