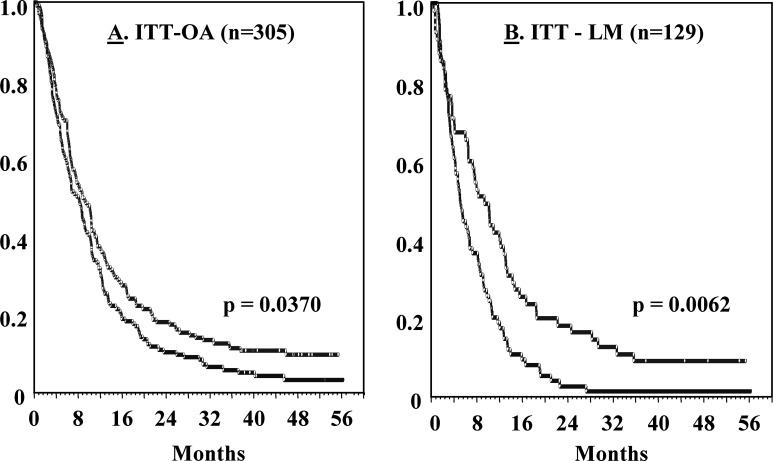
Fig. 1A, B.
Kaplan-Meier survival distribution curves for stage IV melanoma patients receiving IL-2 (blue line) or IL-2 + HDC (red line). For details of demography and patient eligibility, see [6]. Overall toxicities of the regimens used were low, as accounted for in detail elsewhere [9]. A Shows results (analyzed using intention-to-treat) obtained in all patients (ITT-OA group). B Shows results obtained in patients with liver metastasis (ITT-LM group) at study entry. P values refer to comparisons between the IL-2 and IL-2/HDC arms using the log-rank test, followed by the Holm-Sidak method to adjust for multiple analyses (for further information about the statistics applied, see [9])

