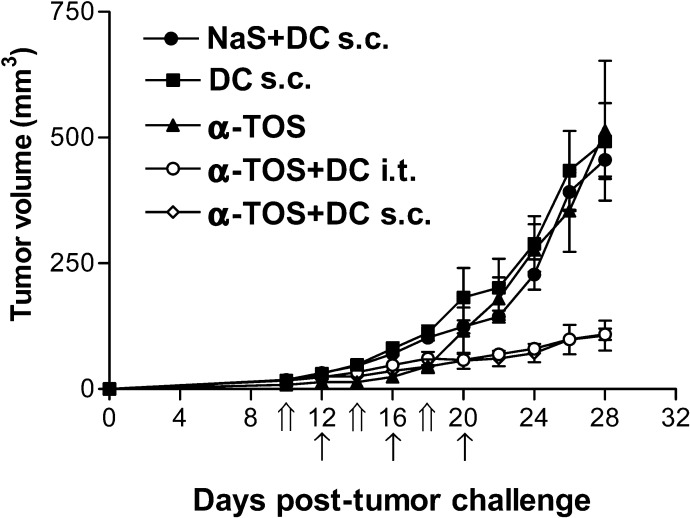
Fig. 5.
Antitumor activity of s.c. versus i.t. DC vaccines. 106 3LL tumor cells were injected s.c. in mice. After development of palpable tumors on day 10, mice were given injections of α-TOS, DCs alone, α-TOS+DCs (i.t.), or α-TOS+DCs (s.c.). α-TOS injections were given on days 10, 14, and 18 (indicated by double arrows on the x-axis) followed by DC injections on days 12,16, and 20 (indicated by single arrows on the x-axis). Data are mean tumor volumes ± SEM of tumor volumes of seven mice per group

