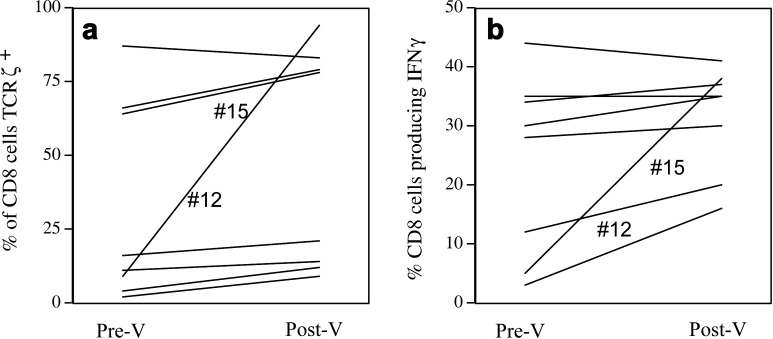
Fig. 4.
Increase following vaccination in the percentage of CD8+ T cells that express normal levels of TCR ζ chain (a) and in the percentage of CD8+ T cells that produce IFN-γ upon stimulation (b). CD8+ T cells from patients’ PBMCs were evaluated for TCR ζ expression without activation. They were activated with PMA/ionomycin to measure intracellular levels of IFN-γ, as described in “Patients and methods.” Samples are from Pre V and the latest Post V time from which cells were available.

