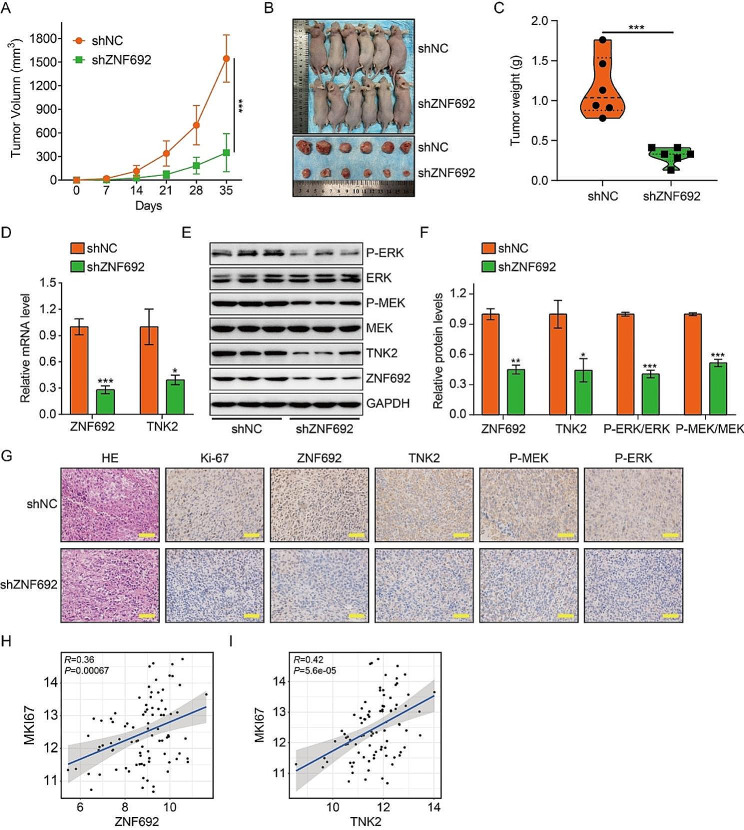
Fig. 7.
Knocking down of ZNF692 inhibits tumor growth in vivo. (A) Tumor volume was monitored every week to compare tumor growth in vivo. (B) Images of xenograft tumors formed in nude mice subcutaneously injected with 143B cells stably knocking down ZNF692 and control cells. (C) Tumor weight was compared between the two groups. (D) qRT-PCR analyses of ZNF692 and TNK2 mRNA levels in xenograft tumors. (E-F) Western blot and quantitative analyses of ZNF692, TNK2, MEK1/2, P-MEK1/2, ERK1/2, and P-ERK1/2 in xenograft tumors. (G) IHC analysis of the expression of Ki-67, ZNF692, TNK2, P-MEK1/2, and P-ERK1/2 in xenograft tumors induced by cells stably knocking down ZNF692 or control cells. Scale bar, 200 μm. (H-I) The expression of ZNF692 and TNK2 were positively correlated with the expression Mki67 based on TCGA dataset. Scale bar: 200 µM. Student’s t-test and one-way ANOVA were performed to analyze differences between groups. All data are presented as means ± standard deviations (SD). *P < 0.05, **P < 0.01, ***P < 0.001

