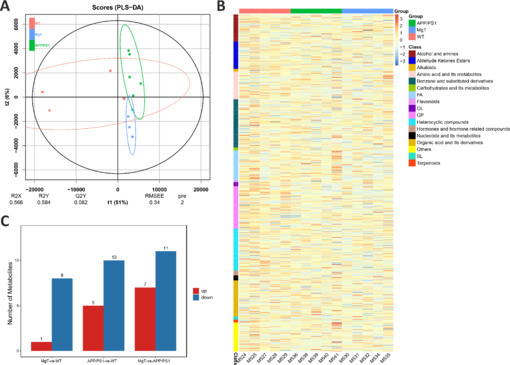
Figure 5.

Identification of serum metabolites significantly altered by MgT treatment in APP/PS1 mice.
(A) PLS-DA plot of serum metabolites in the three groups of mice. (B) Heatmap of relative abundance of all detected metabolites in all samples of the three groups. (C) Numbers of differentially upregulated and downregulated metabolites in each group comparison. APP/PS1: Amyloid-β precursor protein and mutant human presenilin 1; MGT: magnesium-L-threonate; PLS-DA: partial least squares discriminant analysis.
