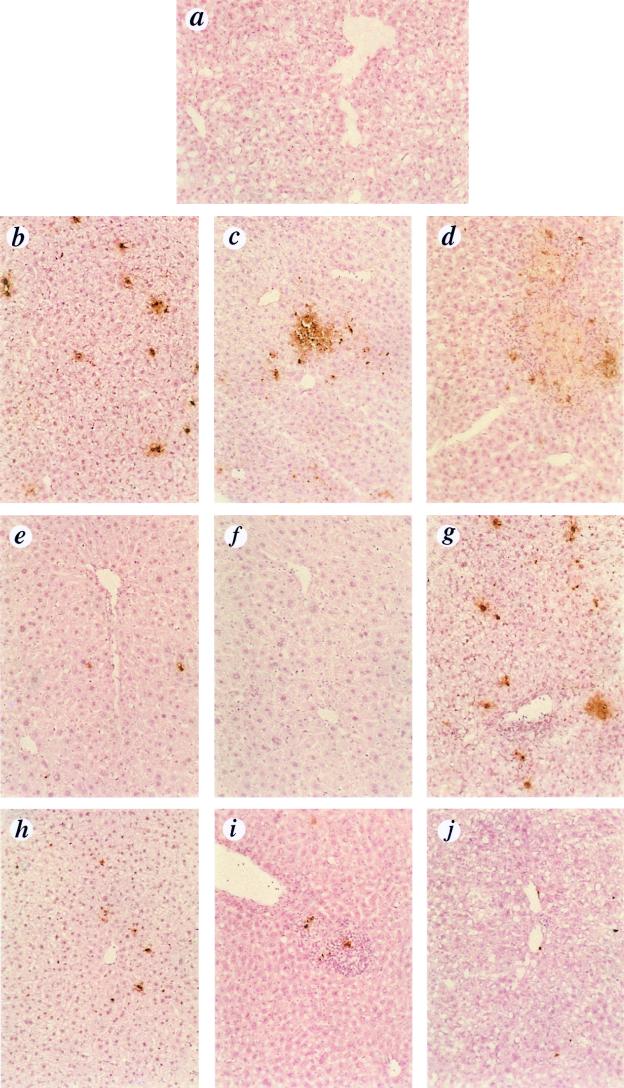
FIG. 3.
TUNEL analysis of liver sections. Adenovirus was administered to mice as described for Fig. 1. Liver sections were obtained at days 1, 2, 5, and 40 p.i. and analyzed for apoptotic cell death by the TUNEL technique (counterstaining with hematoxylin and eosin). (a) Naive mouse; (b) bcl-2tg−/−/Ad.Co, day 1; (c) bcl-2tg−/−/Ad.IκBM, day 1; (d) bcl-2tg−/−/Ad.IκBM, day 2; (e) bcl-2tg+/−/Ad.Co, day 1; (f) bcl-2tg+/−/Ad.IκBM, day 1; (g) bcl-2tg−/−/Ad.Co, day 5; (h) bcl-2tg−/−/Ad.IκBM, day 5; (i) bcl-2tg+/−/Ad.Co, day 5; (j) bcl-2tg+/−/Ad.IκBM, day 5. Note the neutrophil infiltration in panels g and i. Magnification, ×60.

