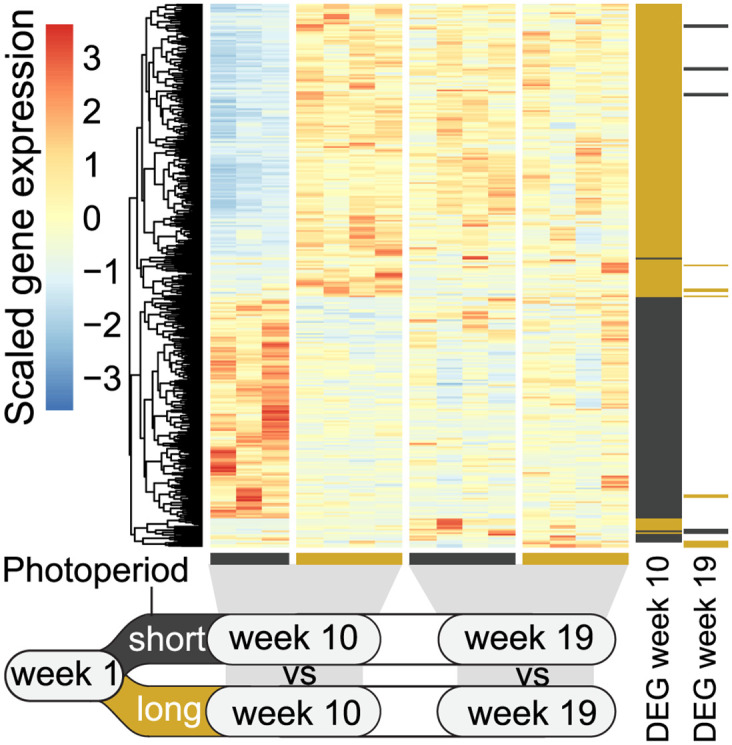
Fig 4. Gene expression changes in response to photoperiod history.

Relative liver expression of differentially expressed genes (DEGs, FDR <0.05) between the short photoperiod group and long photoperiod group at weeks 10 and 19. Genes are marked to the right if differentially expressed higher (black) or lower (yellow) in response to a short photoperiod at weeks 10 and/or 19.
