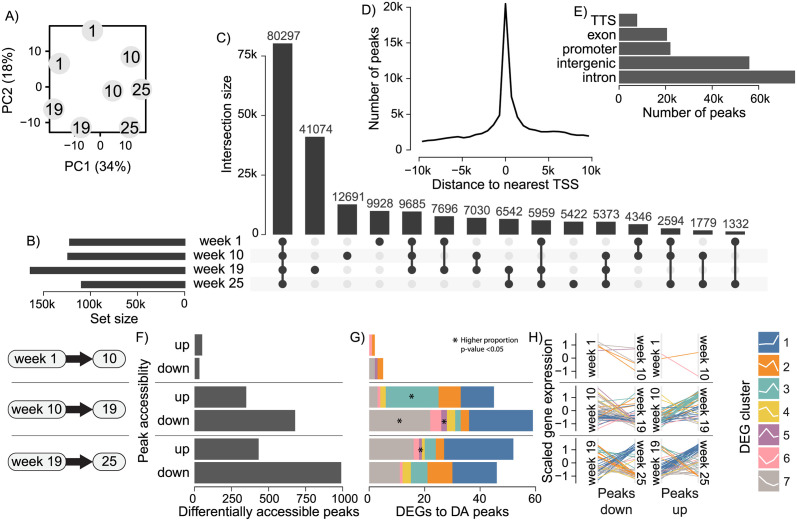
Fig 5. Comparison of chromatin accessibility across life-stage.
A) Similarity of ATAC-seq samples at different weeks by principal component (PC) analysis of read counts within a unified set of ATAC peaks (shared and unique between weeks). B) Number of ATAC peaks called at each week. C) Number of peaks intersecting between sets or unique to each week. D) Distribution of distances (in base pairs, max absolute distance of 10kb) of unified peaks to the nearest gene transcription start site (TSS). E) Genomic locations of unified peaks. F) Number of differentially accessible (DA) peaks between key life-stages with significant (FDR <0.05) fold change up or down in reads overlapping unified peak set. G) Number of differentially expressed genes (DEGs) associated by closest proximity to the DA peaks, colored by co-expression cluster membership. Proportions of gene clusters significantly greater (p-value <0.05) between up and down DA peaks are marked by an asterisks (*), tested by Fisher’s exact test. H) Expression trends across weeks of the DEGs to DA peaks down or up, colored by cluster membership.

