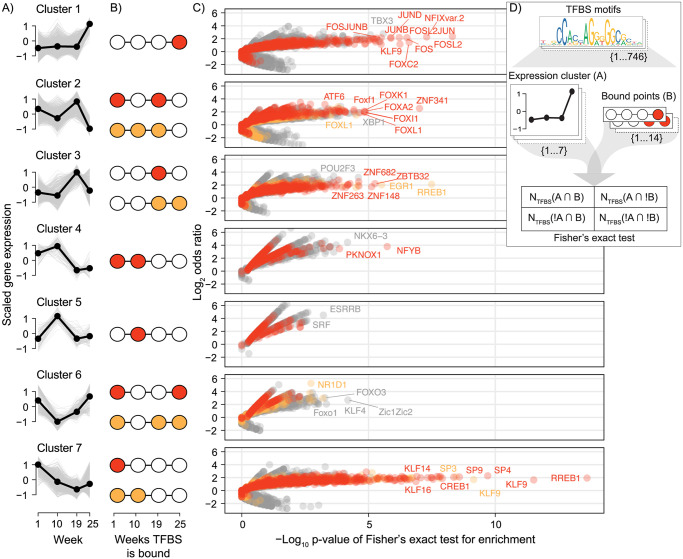
Fig 7. Enrichment of transcription factor binding patterns within gene expression clusters.
A) Gene expression trends of clusters from Fig 1. B) Assumed weeks the transcription factor binding sites (TFBS) near genes in the cluster would be bound by a transcription factor (TF) to regulate transcription at the weeks of highest expression. A primary and secondary assumed binding pattern is colored red and orange respectively. C) For each set of genes in a cluster, each TF was tested if the TFBS near to those genes were enriched for any combination of binding pattern. Fisher’s exact test results for all TF-binding pattern combinations are plotted per cluster as odds ratios against the significance. The test results for the assumed primary and secondary binding patterns in B) are colored red and orange, respectively. A top proportion of the most significant TFs (in a top quantile per test) are labeled. D) Diagram showing how each combination of TFBS motif, expression cluster, and binding pattern was tested for enrichment with a Fisher’s exact test.

