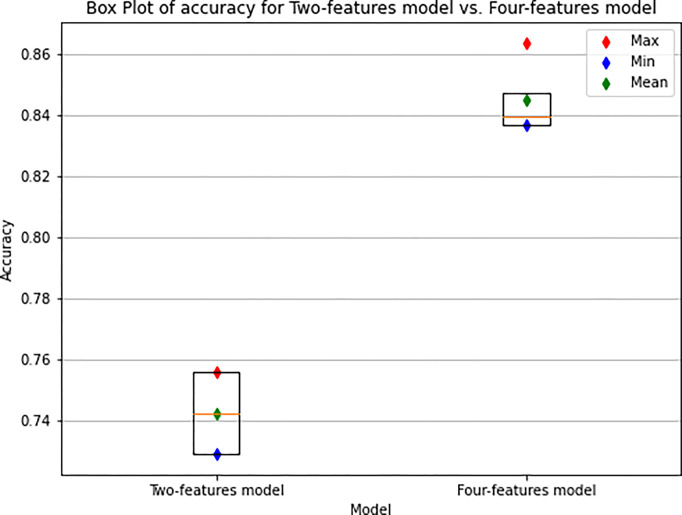
Fig 6. Box Plot of the accuracy of the two-features model and four-features model within the 4 folds.
Each box displays the distribution of model accuracy, with the horizontal line inside it representing the median (the central accuracy value). The upper and lower quartiles of accuracy are depicted as the upper and lower boundaries of the boxes. Additionally, the mean accuracy values, the maximum and minimum accuracy values for each model are also clearly indicated.

