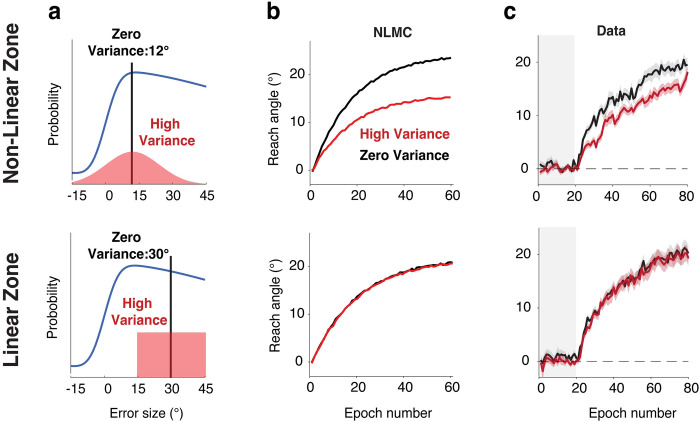
Fig 3. Influence of error variance on adaptation in the clamp rotation task.
| a) Distribution of clamp sizes in Exp 1 (top) and Exp 2 (bottom). In Exp 1, the mean was at 12° for both the High (red) and Zero (black) conditions, with the distribution for the High condition spanning the non-linear zone of the response correction function. In Exp 2, the mean was at 30° and the distribution for the High condition was restricted to the linear, descending zone of the response correction function. b) Simulations of adaptation functions based on the NLMC model. We do not visualize the prediction of the MoE given that it predicts asymptotic values greater than 100°. c) Experimental results in both experiments are consistent with the predictions of the NLMC model. Gray area indicates the no-feedback baseline. Shaded area indicates SE.

