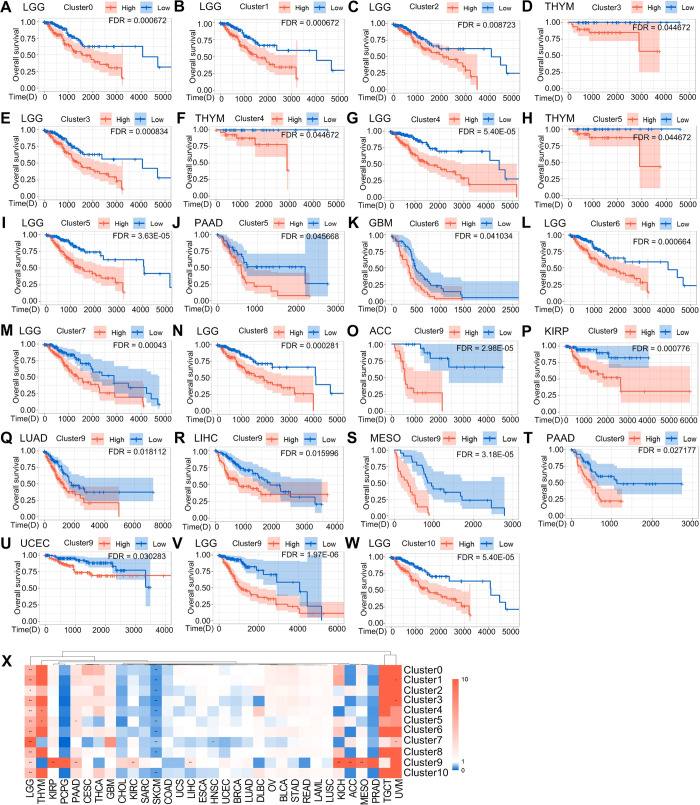
Fig 5. Specific Macrophage subtypes linked to clinical outcome in distinct cancer types.
(A-W) Kaplan-Meier (KM) curves depicting differences in survival of highly and poorly expressed signature genes in multiple subpopulations in different tumors. The light-colored background area is the confidence interval of the probability of survival at each time point calculated by the KM method, which is the 95% confidence interval. (X) Clustering of tumor types by risk ratios of 11 macrophage subpopulations, Time(D) = Time (Days), colors indicate risk ratios (red = risk ratio >1 [poor prognosis], blue = risk ratio < 0.05, * FDR < 0.05, ** FDR < 0.01.

