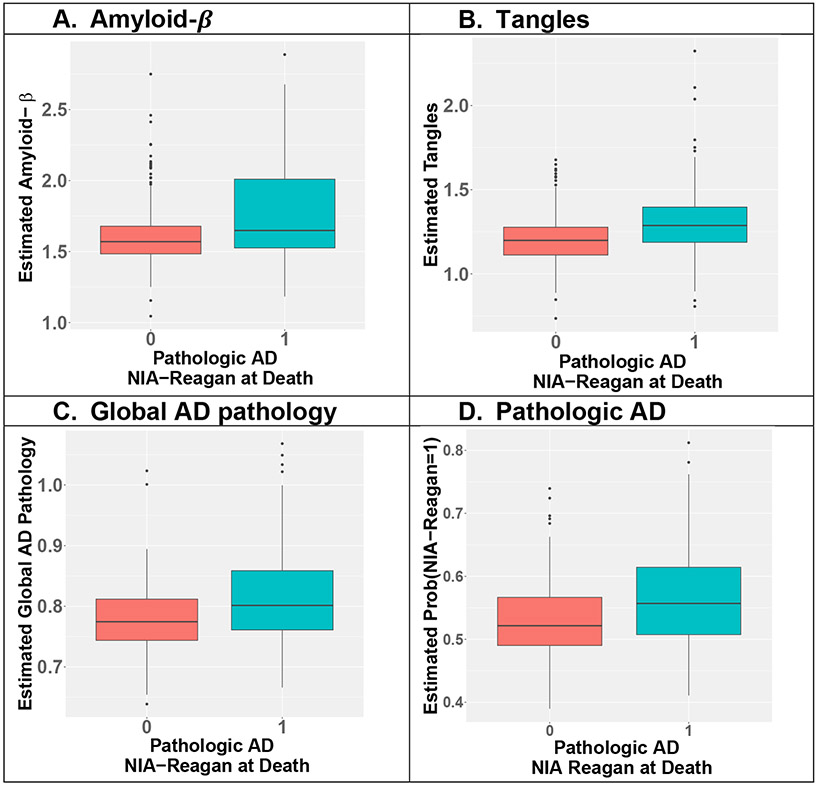
Fig 4. Inferred AD-NC traits at study baseline discriminated postmortem pathologic AD profiled at autopsy.
Pathologic AD here is the binary postmortem NIA-Reagan status profiled at autopsy, with value 1 representing pathologic AD (teal boxplots) and 0 representing no pathologic AD (red boxplots). Two-sample t-test p-values are 1.4 × 10⁻¹⁰ for amyloid-β (A), 1.2 × 10⁻¹¹ for tangles (B), 9.8 × 10⁻¹² for global AD pathology (C), and 1.6 × 10⁻¹⁰ for pathologic AD (D).

