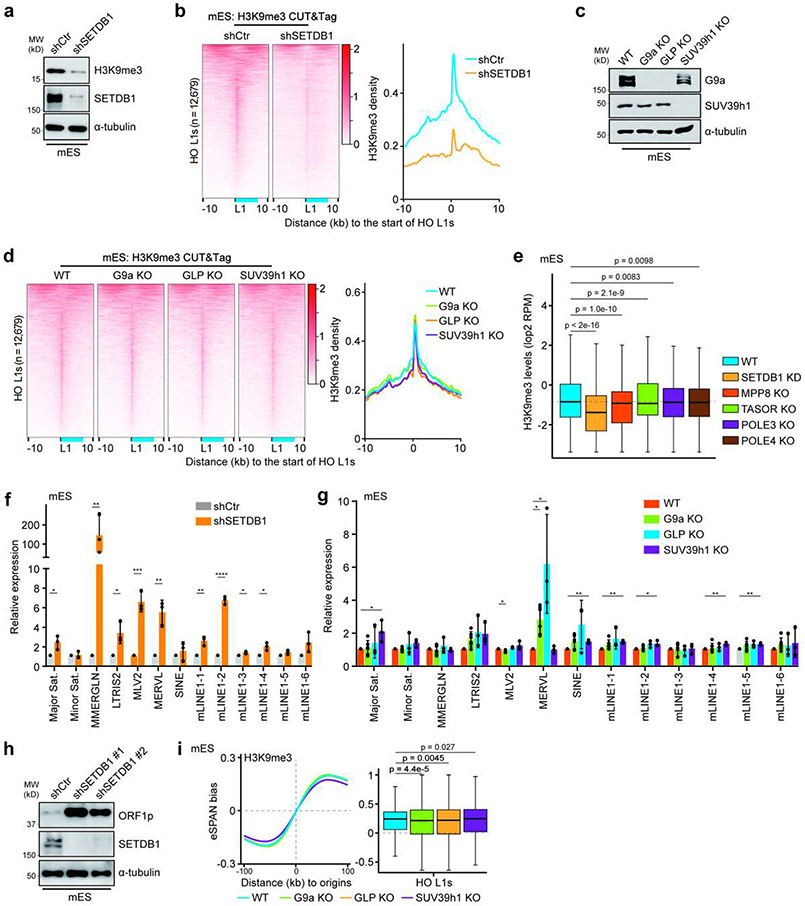
Extended Data Figure 5. Effects of mutating H3K9 methyltransferases on H3K9me3 density and eSPAN bias at L1s in mES cells.
a. SETDB1 depletion reduced H3K9me3 levels dramatically, as detected by immunoblotting. n = 3.
b. Heatmaps (left) and average density (right) of H3K9me3 CUT&Tag signals at all the HO L1s in control (shCtr) and SETDB1 knockdown (shSETDB1) mES cells. Heatmaps were sorted by the average H3K9me3 signals of each row in the control sample. The relative position of a full-length L1 was shown in blue.
c. Immunoblots of G9a and SUV39h1 to confirm the knockout of G9a, GLP and SUV39h1. Note that antibodies against GLP were not working, but GLP knockout also dramatically reduced the levels of its binding partner, G9a. n = 3.
d. Heatmaps (left, sorted as in b) and average density (right) of H3K9me3 CUT&Tag signals at all HO L1s in WT, G9a KO, GLP KO and SUV39h1 KO mES cells.
e. Box plots of H3K9me3 density at all HO L1s (n = 12,679) in WT and mutant mES cells. The dashed line indicates the median of H3K9me3 levels in WT cells.
f, g. Relative expression of representative repetitive elements in SETDB1 KD (f) and G9a, GLP or SUV39h1 KO (g) mES cells compared to control (shCtr) or WT cells by RT-qPCR analysis. Expression was normalized against shCtr or WT. Data were plotted as mean ± SEM. n = 3-6.
h. Immunoblots of ORF1p, the translational products of full-length L1s, in mES cells treated with control or two SETDB1 shRNAs. n = 3.
i. H3K9me3 eSPAN bias around replication origins and at HO L1s (n = 12,679) in WT, G9a KO, GLP KO and SUV39h1 KO mES cells.
Box plots (e, i) show the median, 25% and 75% quartiles and minimal and maximal values with p values by two-sided Mann–Whitney–Wilcoxon tests, and Bonferroni correction for multiple comparisons. f, g, Two-sided Student’s t test. ****, p < 0.0001. ***, p < 0.001. **, p < 0.01. *, p < 0.05. Each panel is a representative of at least two independent experiments. See Materials and Methods for more details.
For gel source data, see Supplementary Figure 1.

