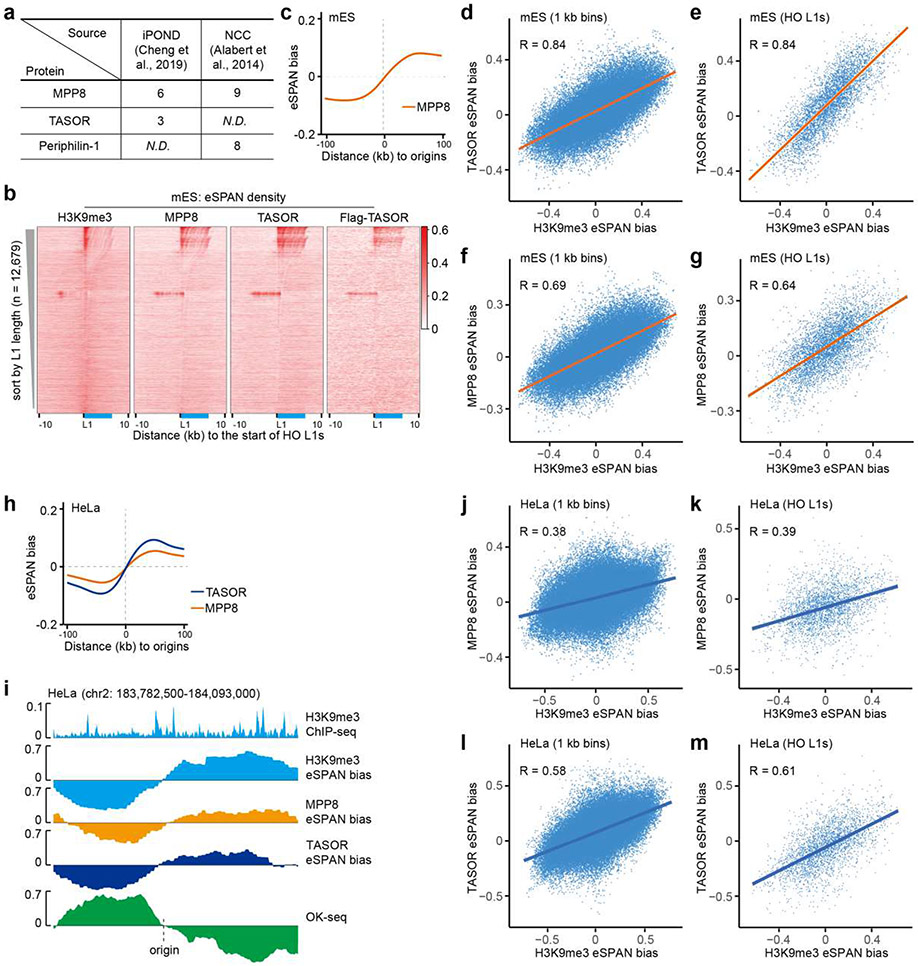
Extended Data Figure 8. The HUSH complex is enriched at the leading strands of DNA replication forks.
a. Detection of the HUSH complex subunits at replication forks based on published iPOND (isolation of proteins on nascent DNA)37 and NCC (nascent chromatin capture)36 datasets. Numbers of peptides identified were shown. N.D., not detected.
b. Heatmaps of normalized eSPAN density of H3K9me3, MPP8, TASOR and Flag-TASOR at HO L1s, sorted by L1 length. The relative position of a full-length L1 was shown in blue.
c. Average MPP8 eSPAN bias around all 1,928 replication origins in mES cells.
d-g. Correlations between the biases of TASOR eSPAN and H3K9me3 eSPAN (d, e) or the biases between MPP8 eSPAN and H3K9me3 eSPAN (f, g) in mES cells. Each dot represents a 1 kb bin (d, f) or a HO L1 (e, g) within the 1,928 initiation zones (−100 kb, 100 kb). Spearman’s rank correlation coefficient was shown. p < 2.2e-16.
h. Average MPP8 and TASOR eSPAN bias around all 2,809 replication origins in HeLa cells.
i. A snapshot of H3K9me3 ChIP-seq and calculated eSPAN biases of H3K9me3, MPP8 and TASOR in HeLa cells. OK-seq bias was shown to mark origin location.
j-m. Correlations between the biases of MPP8 eSPAN and H3K9me3 eSPAN (j, k) or between TASOR and H3K9me3 (l, m) in HeLa cells. Each dot represents a 1 kb bin (j, l) or a HO L1(k, m) within the 2,809 initiation zones in HeLa cells (−100 kb, 100 kb). Spearman’s rank correlation coefficient was shown. p < 2.2e-16.

