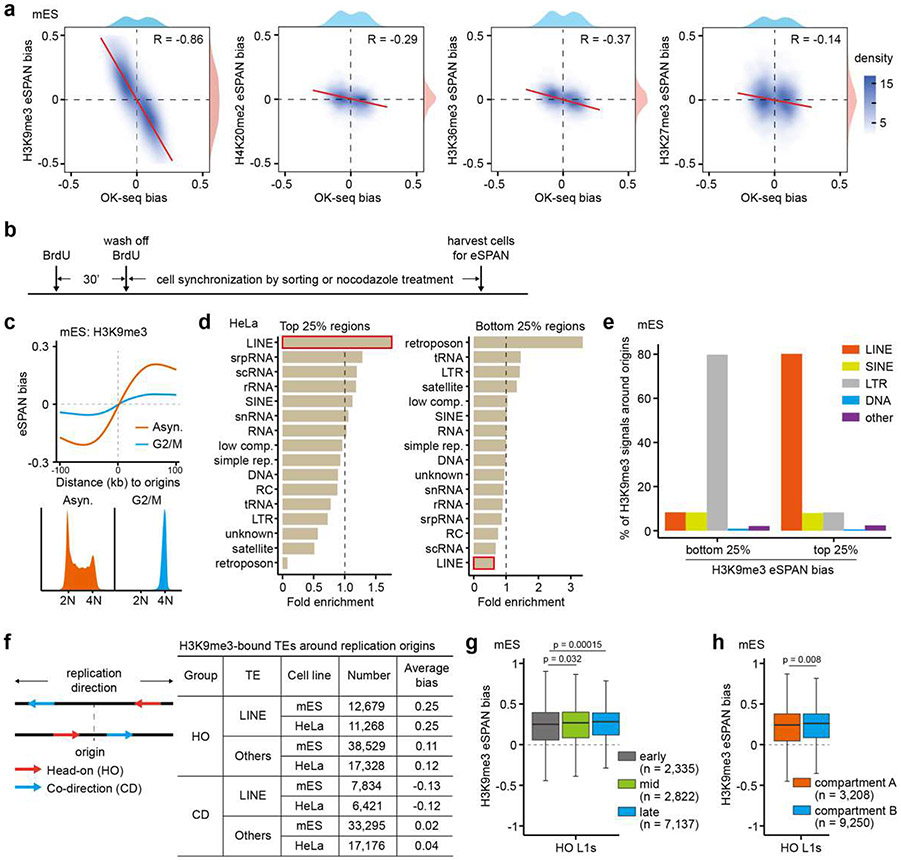
Extended Data Figure 3. LINE retrotransposons contribute to the asymmetric H3K9me3 distribution.
a. Correlations between OK-seq bias and eSPAN bias of H3K9me3, H4K20me2, H3K36me3, or H3K27me3. Spearman’s rank correlation coefficient and the density distribution were shown.
b. Experimental schemes for eSPAN analysis in synchronized mES cells shown in Figure 2a and Extended Data Figure 3c. After pulsing cells with BrdU for 30 min, cells were either sorted by flow cytometry based on the FUCCI reporters (Figure 2a) or treated with nocodazole (Extended Data Figure 3c). See Materials and Methods section for more details.
c. Average H3K9me3 eSPAN in asynchronized mES cells or cells synchronized at G2/M phase. Bottom: flow cytometry analysis of cell cycle of asynchronized mES cells and cells arrested at G2/M by nocodazole.
d. The relative enrichment of different repetitive elements at 1kb bins with high or low H3K9me3 eSPAN bias surrounding DNA replication origins in HeLa cells. DNA sequences around replication origins were fragmented into 1 kb bin, and ranked based on H3K9me3 eSPAN bias. The top 25% of regions with the highest H3K9me3 eSPAN bias and the bottom 25% with the lowest H3K9me3 eSPAN bias were then used for calculating the enrichment of each indicated DNA element. Fold enrichment is defined as the ratio between the calculated and expected enrichment. com., complexity; rep., repeats.
e. Percentage of the accumulative H3K9me3 ChIP-seq signals at different TEs around replication origins with highest (top quartile) and lowest (bottom quartile) H3K9me3 eSPAN bias defined in Figure 2b.
f. A schematic representation showing L1 elements whose transcription direction is head-on (HO) and co-direction (CD) with the direction of replication fork movement (left). The numbers and average H3K9me3 eSPAN bias of different TEs within the (−100 kb to 100 kb) regions of 1,928 origins in mES cells and 2,809 origins in Hela cells were counted and shown. Others: all other TEs excluding LINEs.
g. Box plots of H3K9me3 eSPAN bias at HO L1s separated by their locations in the early, mid or late replicating origins, which are defined based on the replication timing data in mES cells.
h. Box plots of H3K9me3 eSPAN bias at HO L1s separated by their locations in genome compartment A or B based on Hi-C datasets in mES cells.
Box plots (g, h) show the median, 25% and 75% quartiles and minimal and maximal values with p values by two-sided Mann–Whitney–Wilcoxon tests. Each panel is a representative of at least two independent experiments. See Materials and Methods for more details.

