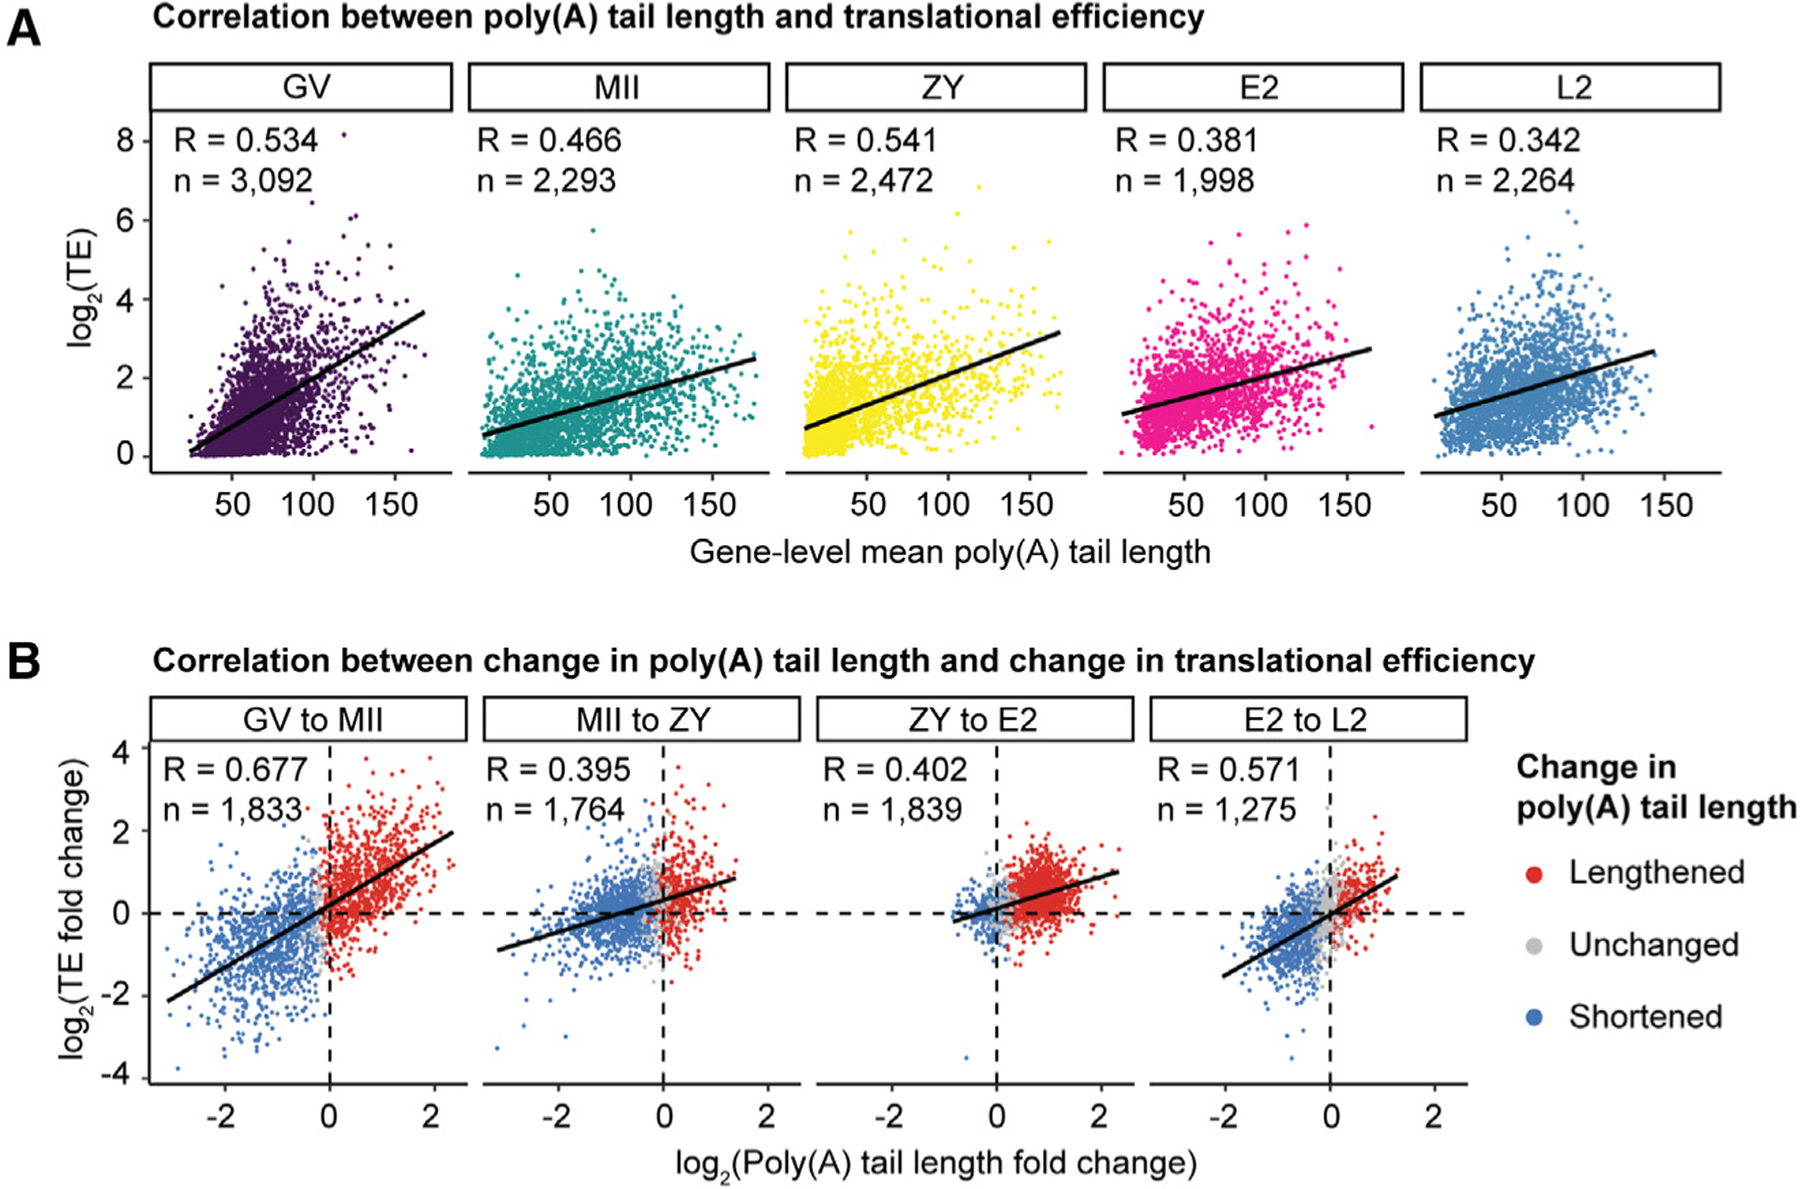
Figure 4. Poly(A) tail length positively correlates with translational efficiency during the OET.

(A) Correlation between poly(A) tail length and translational efficiency at each developmental stage.
(B) Correlation between change in poly(A) tail length and change in translational efficiency at each stage transition, colored by change in tail length. n, number of genes; R, Pearson correlation coefficient; TE, translational efficiency.
