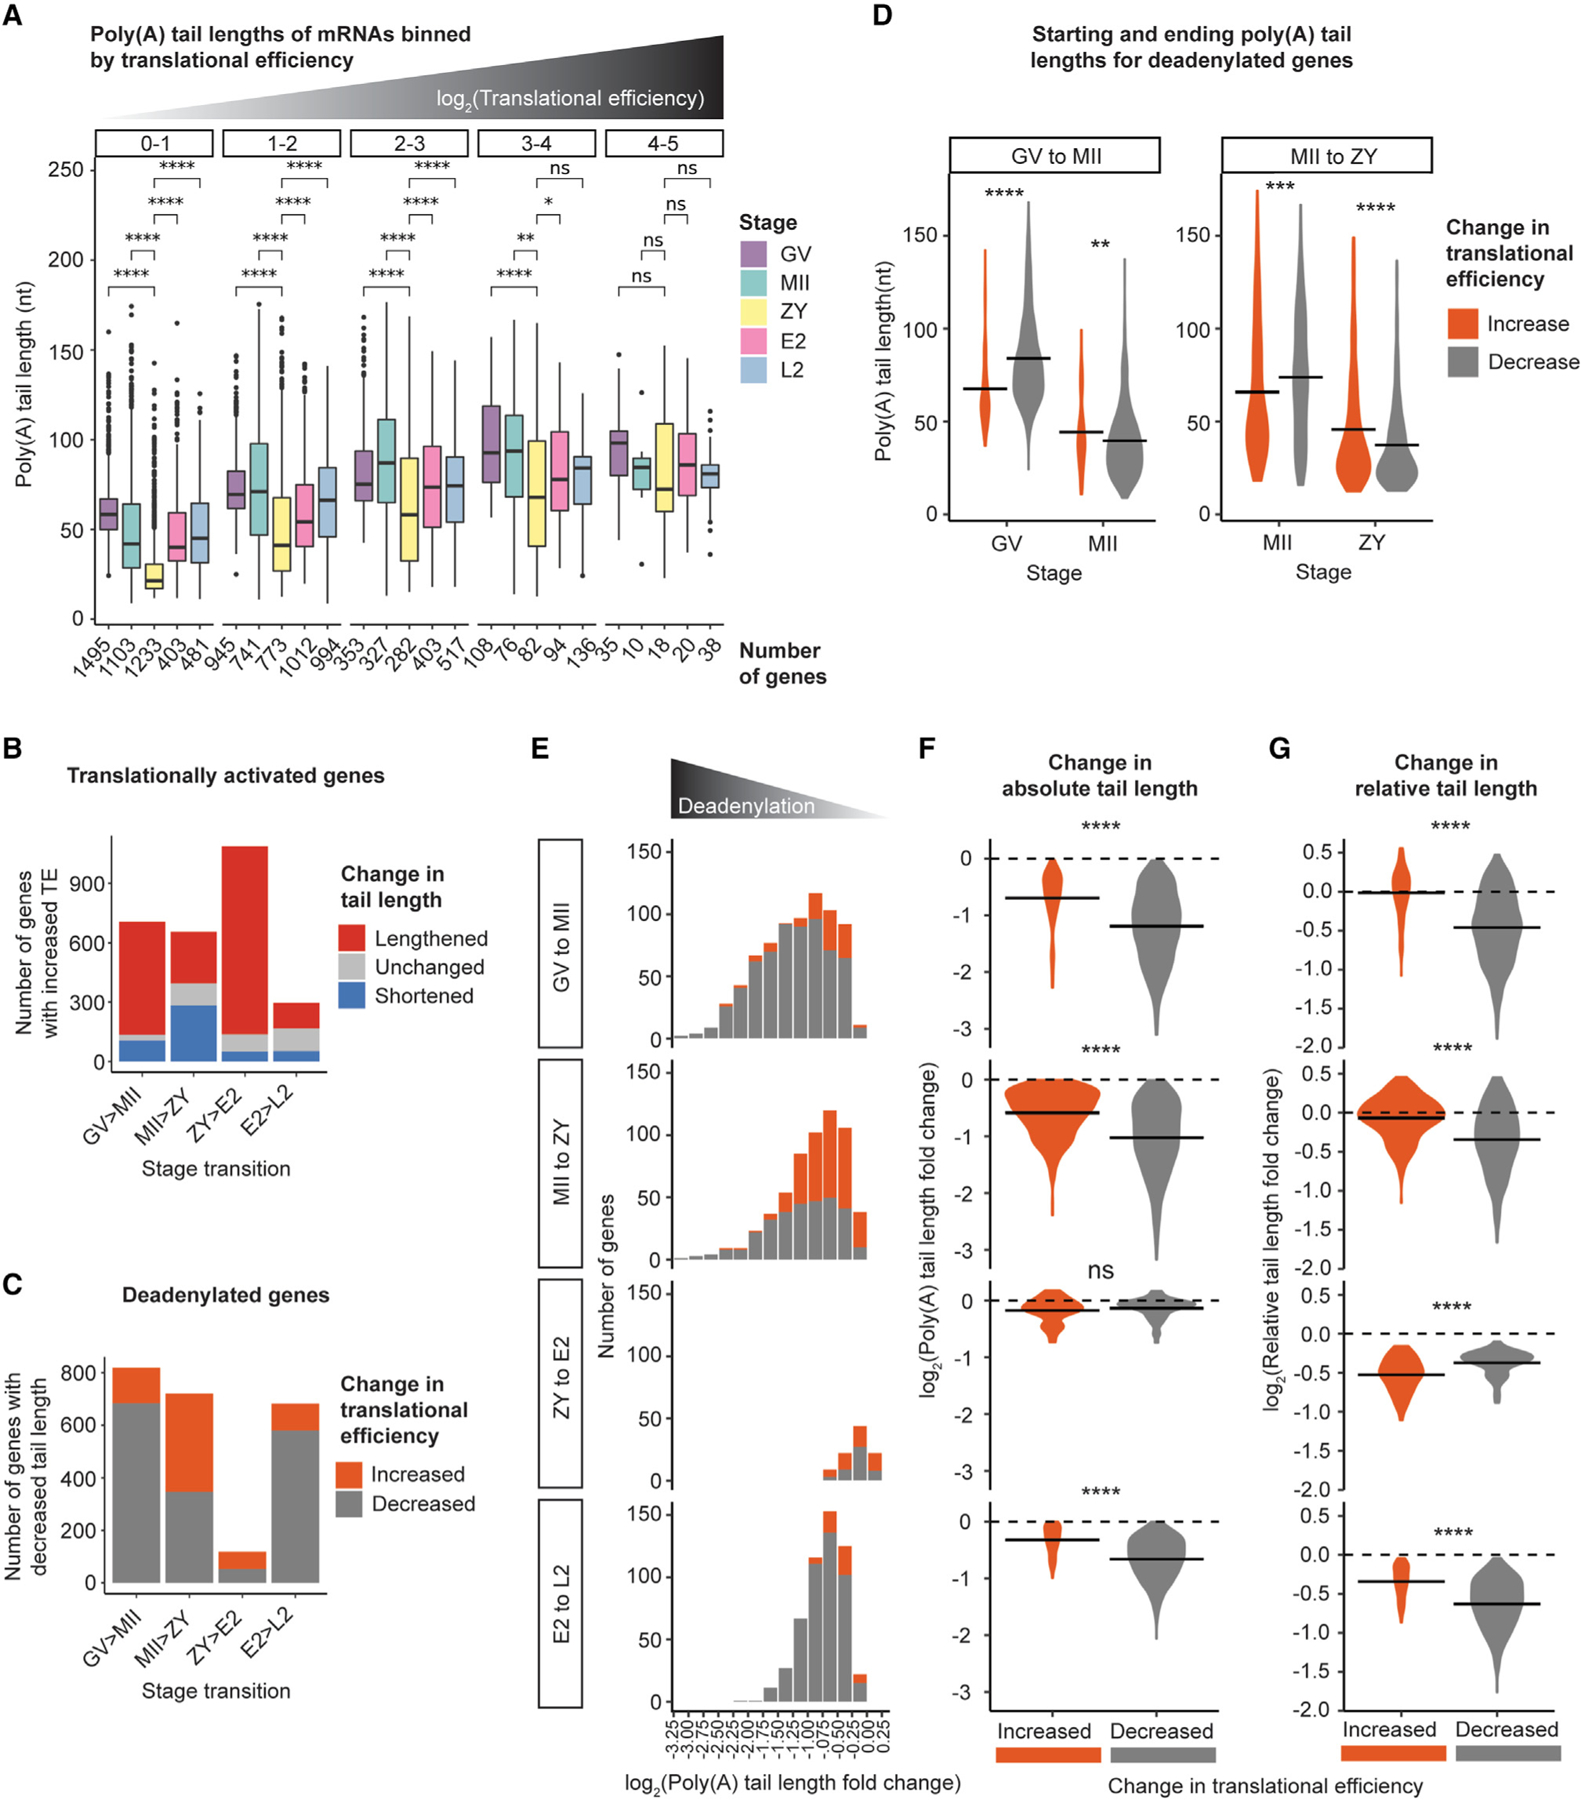
Figure 6. Global deadenylation reorders relative mRNA poly(A) tail length distributions to activate translation without polyadenylation.

(A) Poly(A) tail lengths of genes binned by TE (plot facets) at each developmental stage. Pairwise two-sided Wilcoxon tests are shown for all stages compared with ZY (ns, p > 0.05; *p ≤ 0.05; **p ≤ 0.01; ****p ≤ 0.0001). The number of genes in each bin is indicated below the x axis. Only bins with R10 genes are plotted.
(B) Number of translationally activated genes with lengthened (red), shortened (blue), and not significantly changed (gray) tail lengths across each stage transition.
(C) Number of deadenylated-activated (orange) or -repressed (gray) genes across each stage transition.
(D) Mean poly(A) tail lengths for deadenylated-activated or -repressed genes at each stage from GV to MII and MII to ZY.
(E) Number of deadenylated-activated (orange) or -repressed (gray) genes, binned by magnitude of deadenylation across each stage transition.
(F and G) Log2 fold change in absolute (F) or relative (G) tail length for deadenylated-activated (orange) or -repressed (gray) genes across each stage transition. For (D, F, and G), horizontal lines indicate arithmetic means and two-sided Wilcoxon tests are shown (ns, p > 0.05; **p ≤ 0.01; ***p ≤ 0.001; ****p ≤ 0.0001). For (B)–(G), to include genes translationally activated or repressed despite no significant change in tail length, the adjusted p value cutoff for classifying genes as “deadenylated” was removed.
