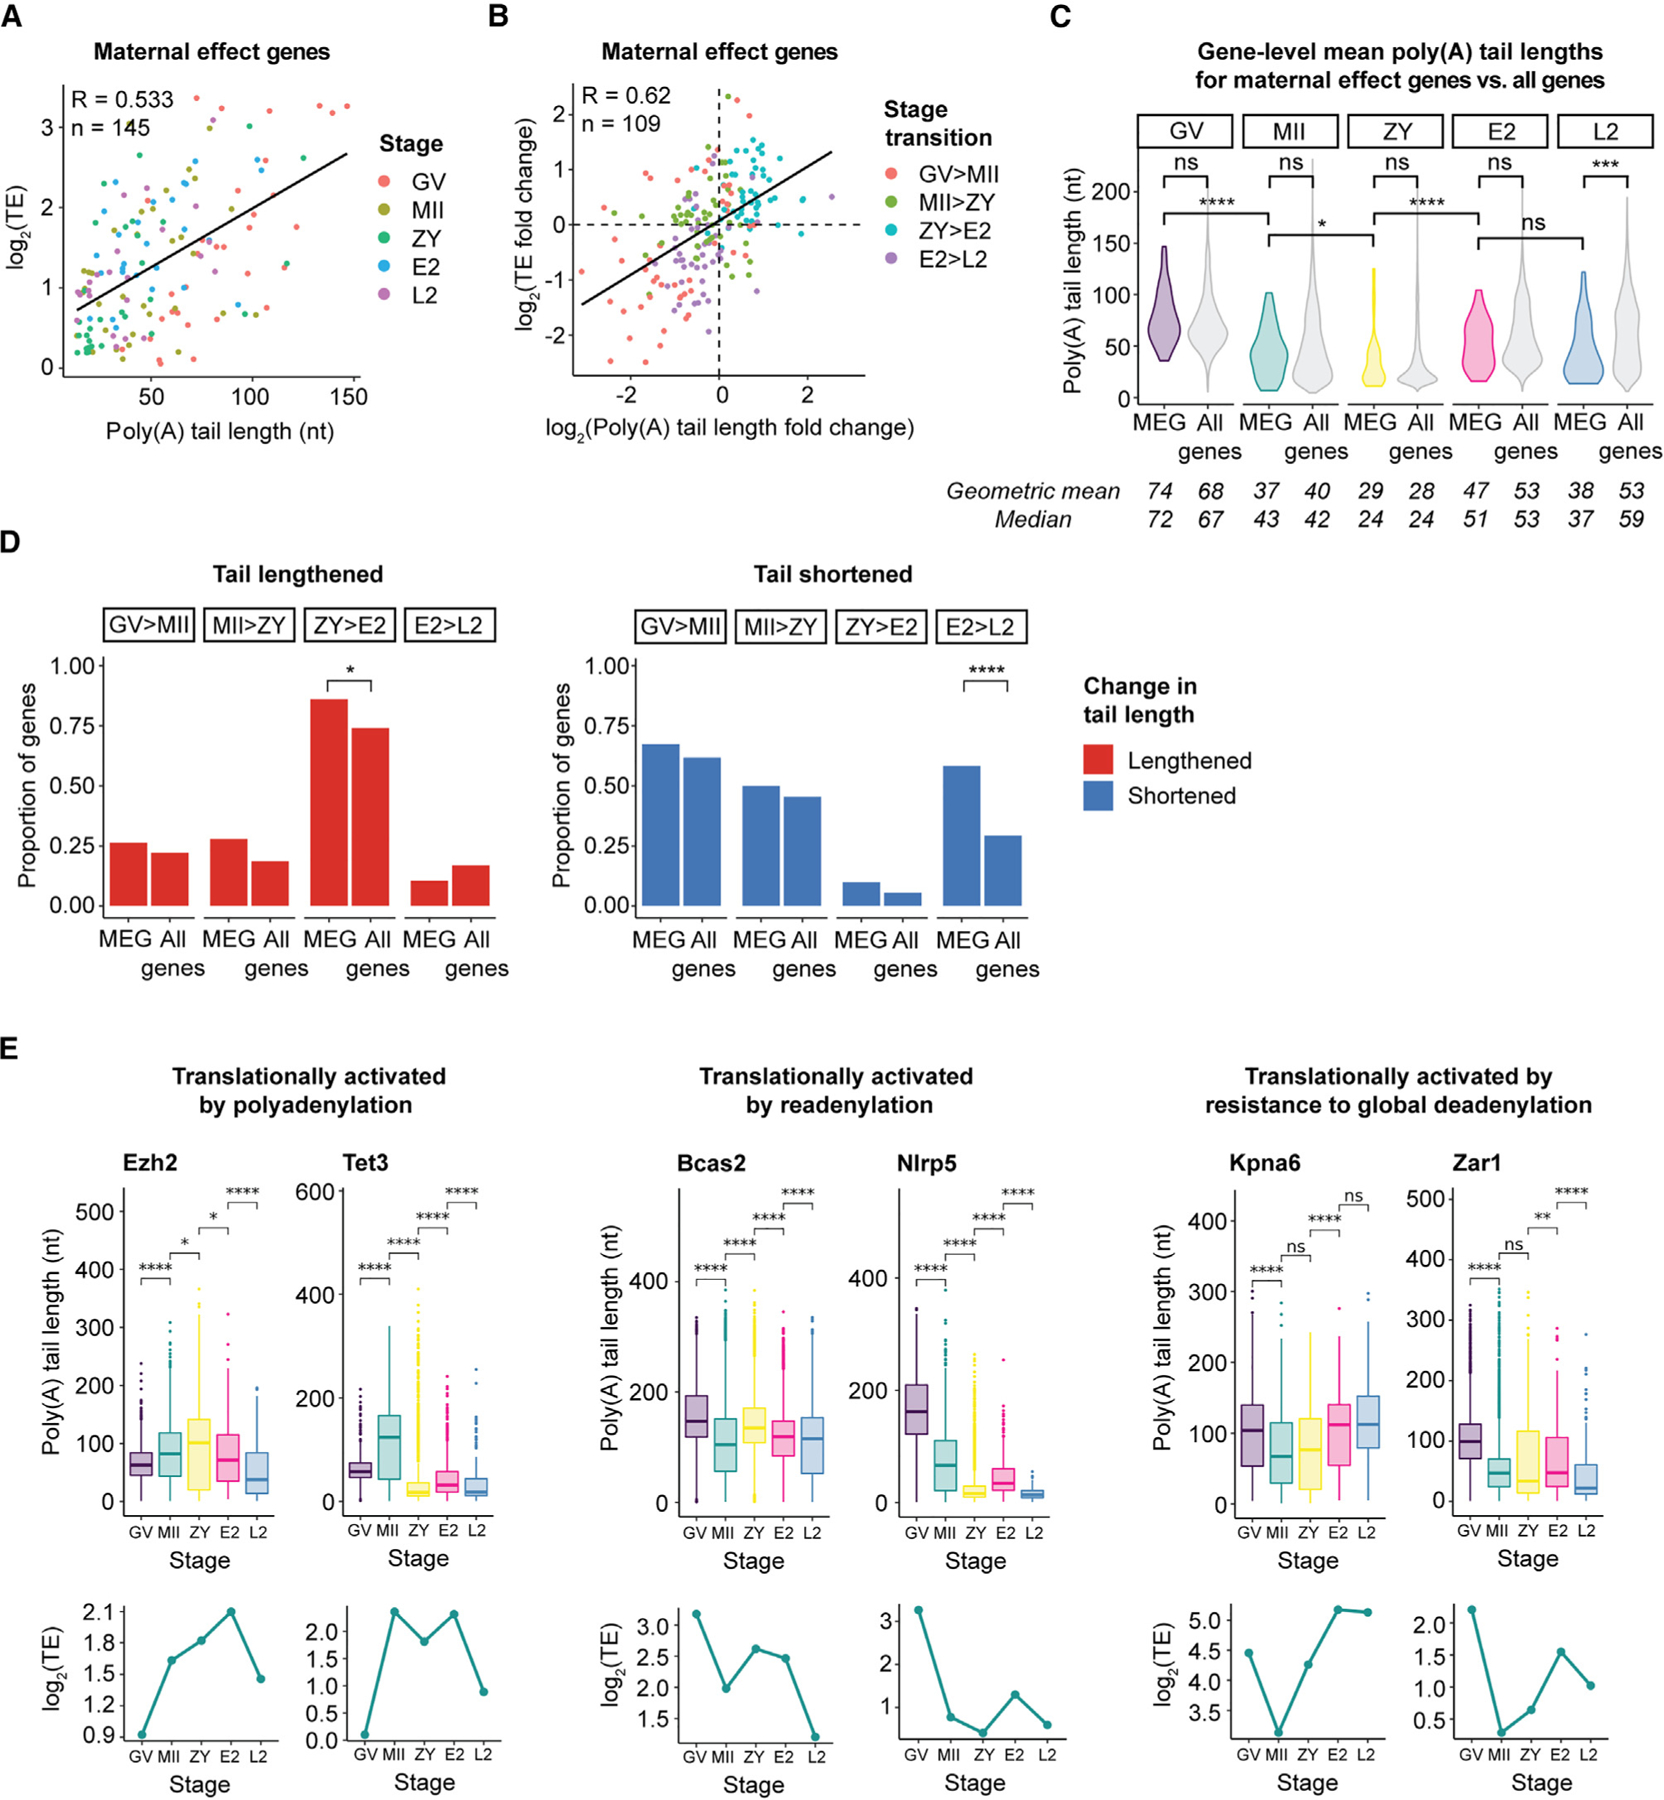
Figure 7. TE of maternal effect genes (MEGs) critical for development is regulated by dynamic changes in poly(A) tail length.

(A) Correlation between poly(A) tail length and TE for MEGs.
(B) Correlation between change in poly(A) tail length and change in TE for MEGs.
(A and B) Genes were filtered by ≥1 FPKM in the RNA-seq dataset used to calculate TE.62 n, number of reads; R, Pearson correlation coefficient; TE, translational efficiency.
(C) Violin plots showing global distributions of gene-level mean poly(A) tail lengths at each stage for MEGs (colored) compared with all genes (gray). Means/medians of distributions are provided. Only genes with ≥10 polyadenylated reads in both biological replicates combined were included. Pairwise two-sided Wilcoxon tests are shown (ns, p > 0.05; *p ≤ 0.05; ***p ≤ 0.001; ****p ≤ 0.0001).
(D) Proportion of MEGs or all genes with significantly (adjusted p < 0.05) lengthened (red, left) or shortened (blue, right) tail lengths at each stage transition. Only genes with R10 polyadenylated reads in both stages represented were included. Pairwise one-sided Fisher’s exact tests are shown (ns, p > 0.05; *p ≤ 0.05; ***p ≤ 0.001; ****p ≤ 0.0001).
(E) Poly(A) tail lengths (top) and translational efficiencies (bottom) of select MEGs across the OET. Each boxplot represents ≥20 polyadenylated reads. Pairwise two-sided Wilcoxon tests are shown (ns, p > 0.05; *p ≤ 0.05; **p ≤ 0.01; ****p ≤ 0.0001).
