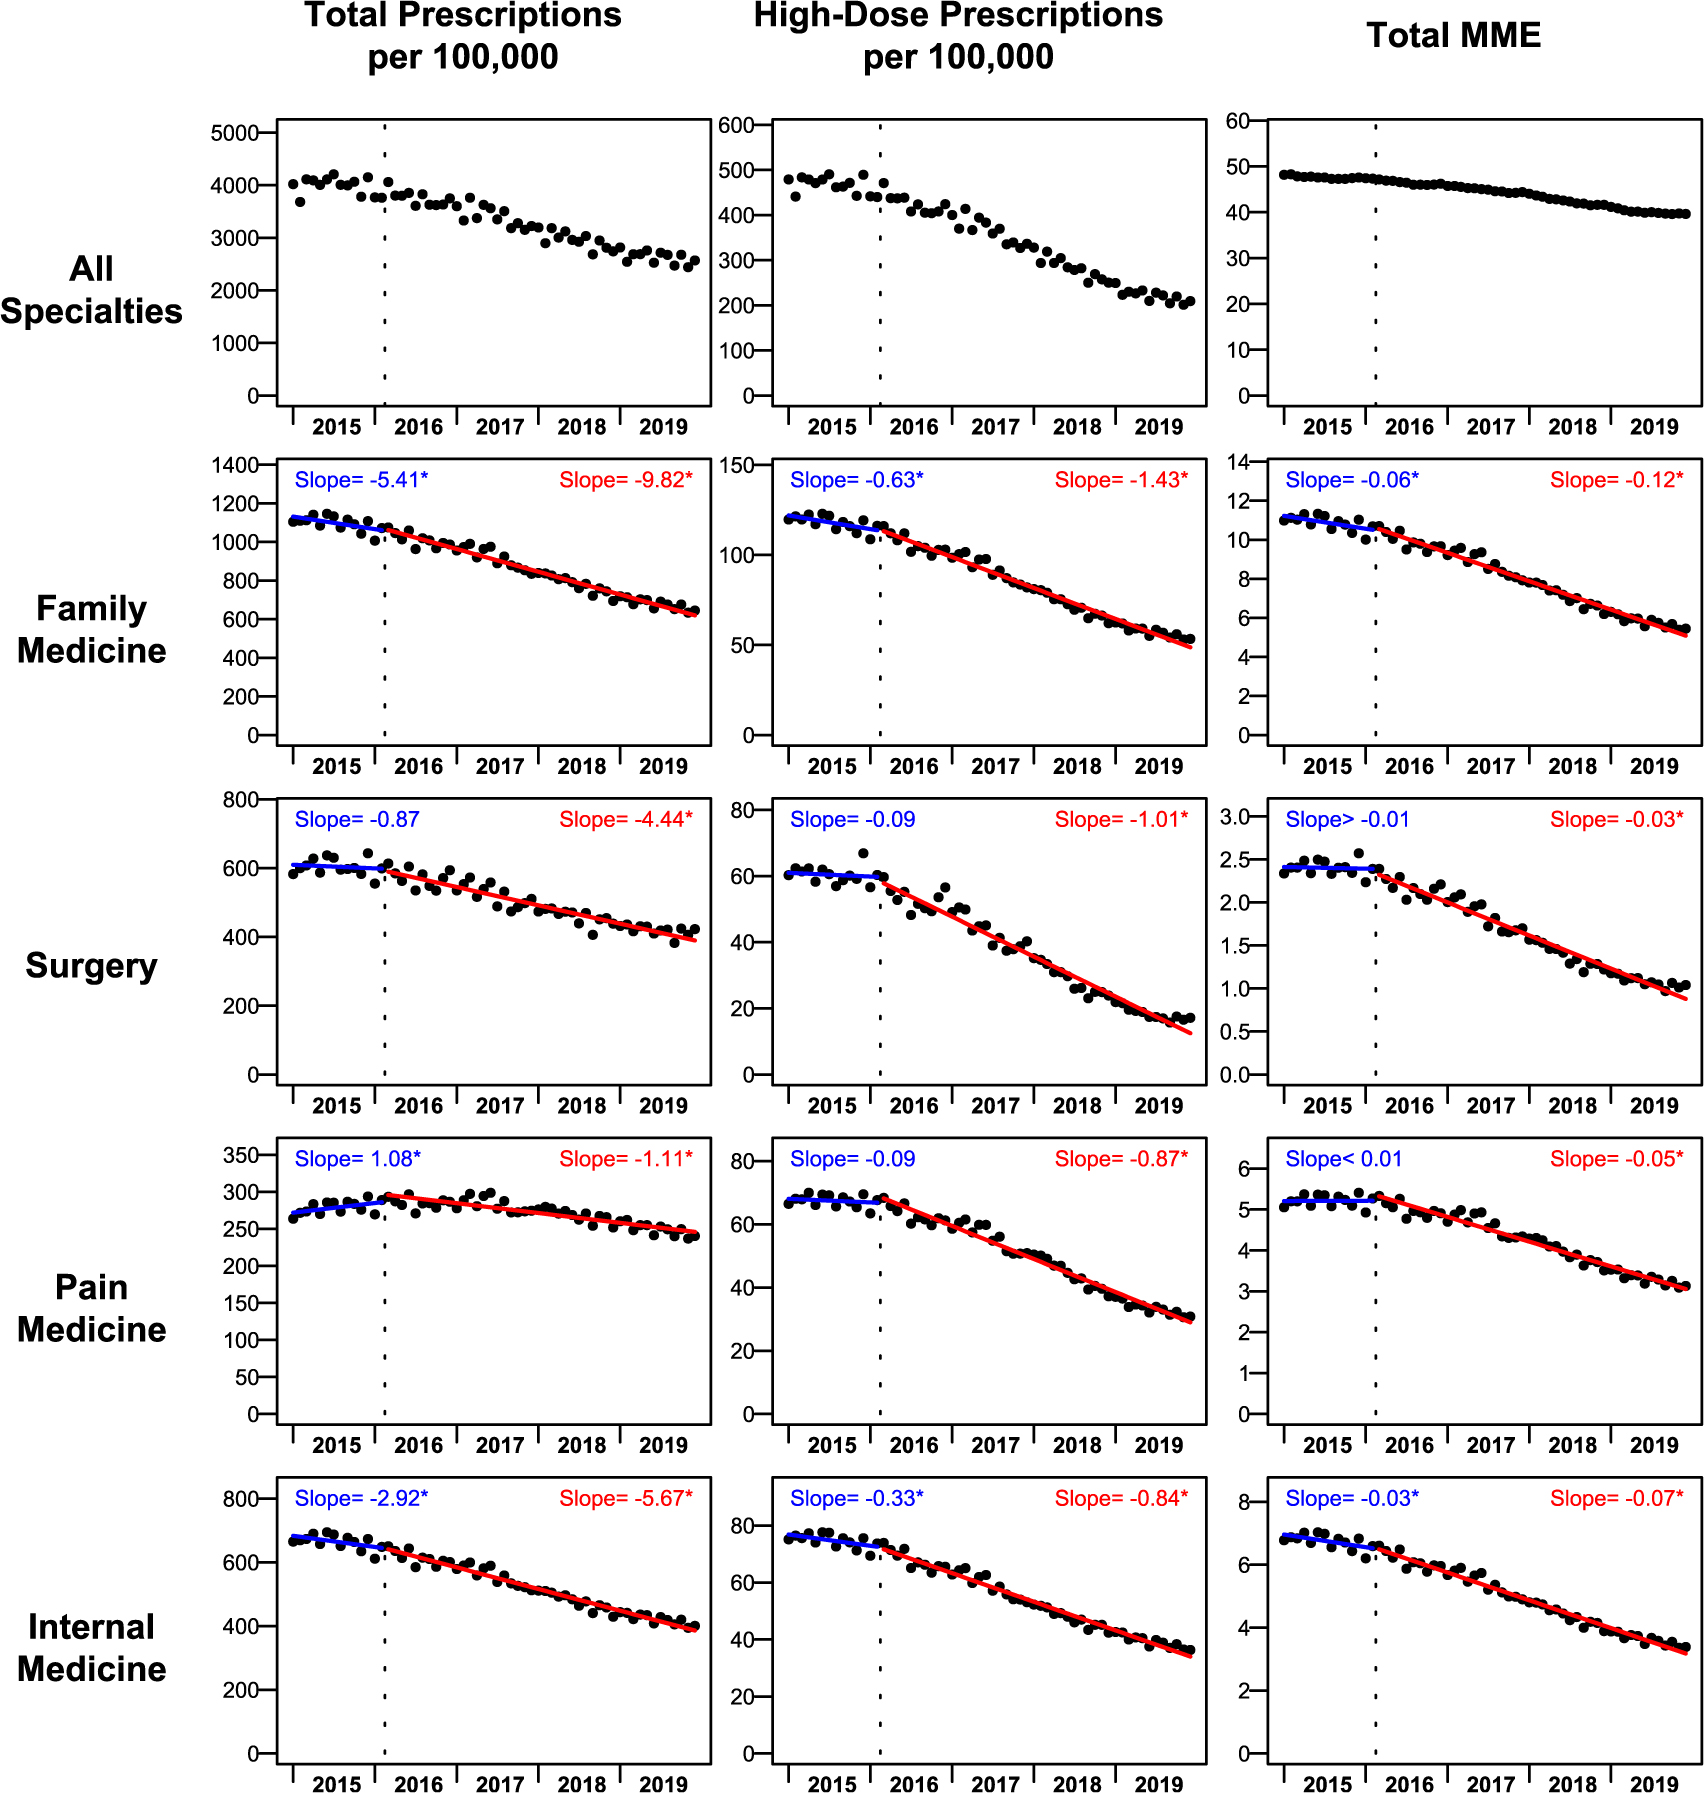
Figure 1.

Total monthly opioid prescriptions dispensed per 100,000, high-dose prescriptions dispensed per 100,000, and total monthly MME dispensed per person by clinician specialty—United States, 2015–2019. Monthly trends in three characteristics of opioid dispensing (number of prescriptions, number of high-dose prescriptions, and total MME) are illustrated across all clinician specialties (top row) and for the four specialties (lower four rows) in which dispensing changed most after the release of the CDC Guideline in March 2016 (denoted by the dotted line). Each point represents prescriptions dispensed for one calendar month, standardized to a 30-day month length. Numbers of monthly prescriptions dispensed (left column) and high-dose prescriptions dispensed (middle column) are presented per 100,000 population; total monthly MME dispensed (right column) is presented per 1 population. Modeled monthly trendlines are depicted for before the release (blue lines) and after the release (red lines) of the CDC Guideline, accompanied by slopes estimated for each trendline. Asterisks (*) indicate statistically significant (P < 0.05) coefficients for slope (before release, blue) or change in slope (after release, red) for each statistic reported. Clinician specialty groups are detailed in Supplementary Data Table S1.
