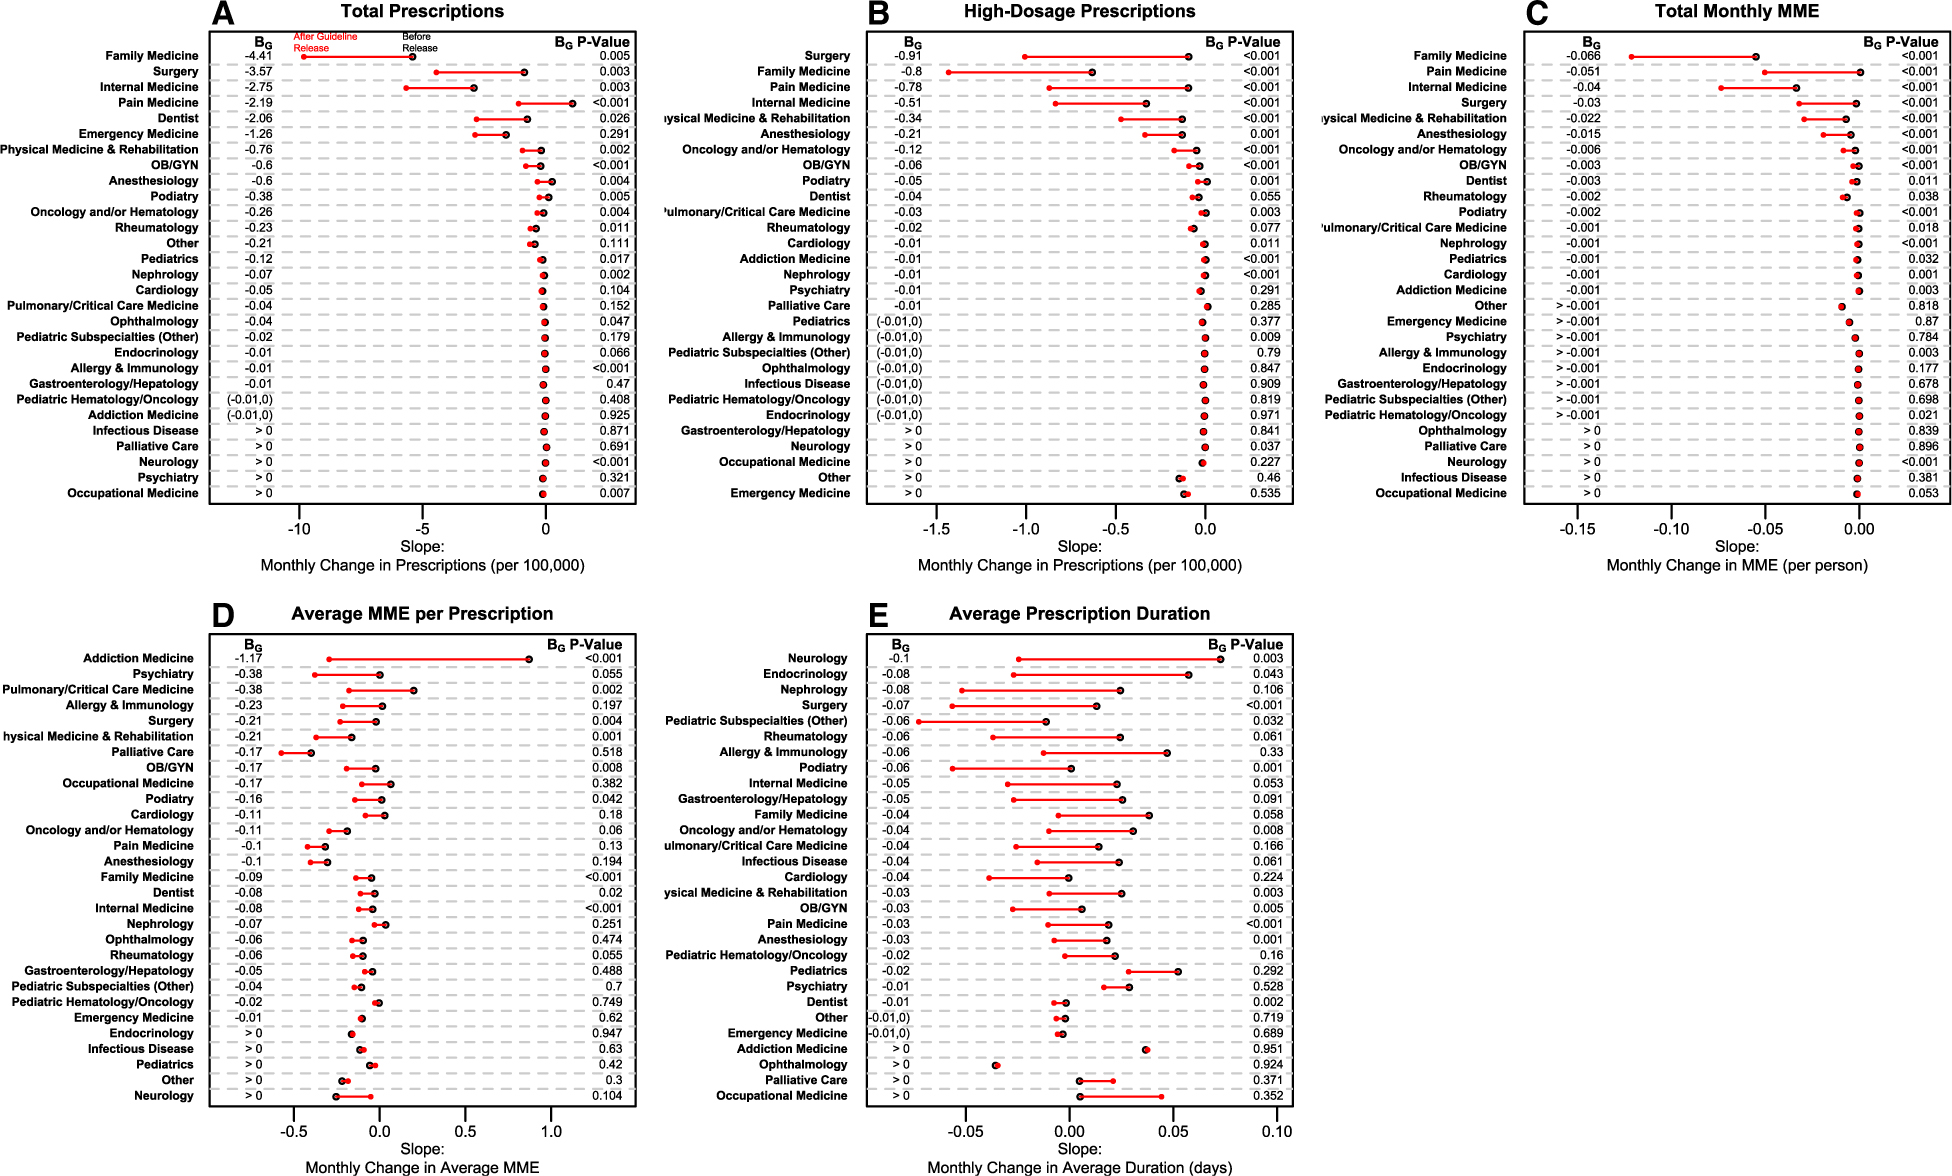
Figure 2.

Trends in opioid prescription dispensing characteristics by provider specialty—United States, 2015–2019. Each panel represents, for 29 provider specialties, the slope of modeled trendlines in opioid dispensing characteristics before the release (black, open circles) and after the release (red, solid circles) of the CDC Guideline, sorted by greatest declines after release. Faster declines after the release of the CDC Guideline occurred in specialties where red, solid circles appear to the left of black, open circles. Solid lines illustrate the change in slope after the release of the CDC Guideline (BG), which are reported on the left of each panel; values listed as “(−0.01, 0)” indicate slope estimates in the range of (−0.01, 0). P values for each specialty’s BG are reported on the right of each panel. Panel A illustrates monthly changes in total opioid prescriptions dispensed per 100,000 population. Panel B illustrates monthly changes in high-dose opioid prescriptions dispensed per 100,000 population. Panel C illustrates monthly changes in total MME dispensed per 1 population. Panel D represents monthly changes in mean MME per prescription dispensed. Panel E represents monthly changes in mean duration of dispensed prescriptions as measured in days. Clinician specialty groups are detailed in Supplementary Data Table S1.
