
Extended Data Figure 8. RGFP966 has no effect on generalized gliosis in the toxin-based injury model of LPC.
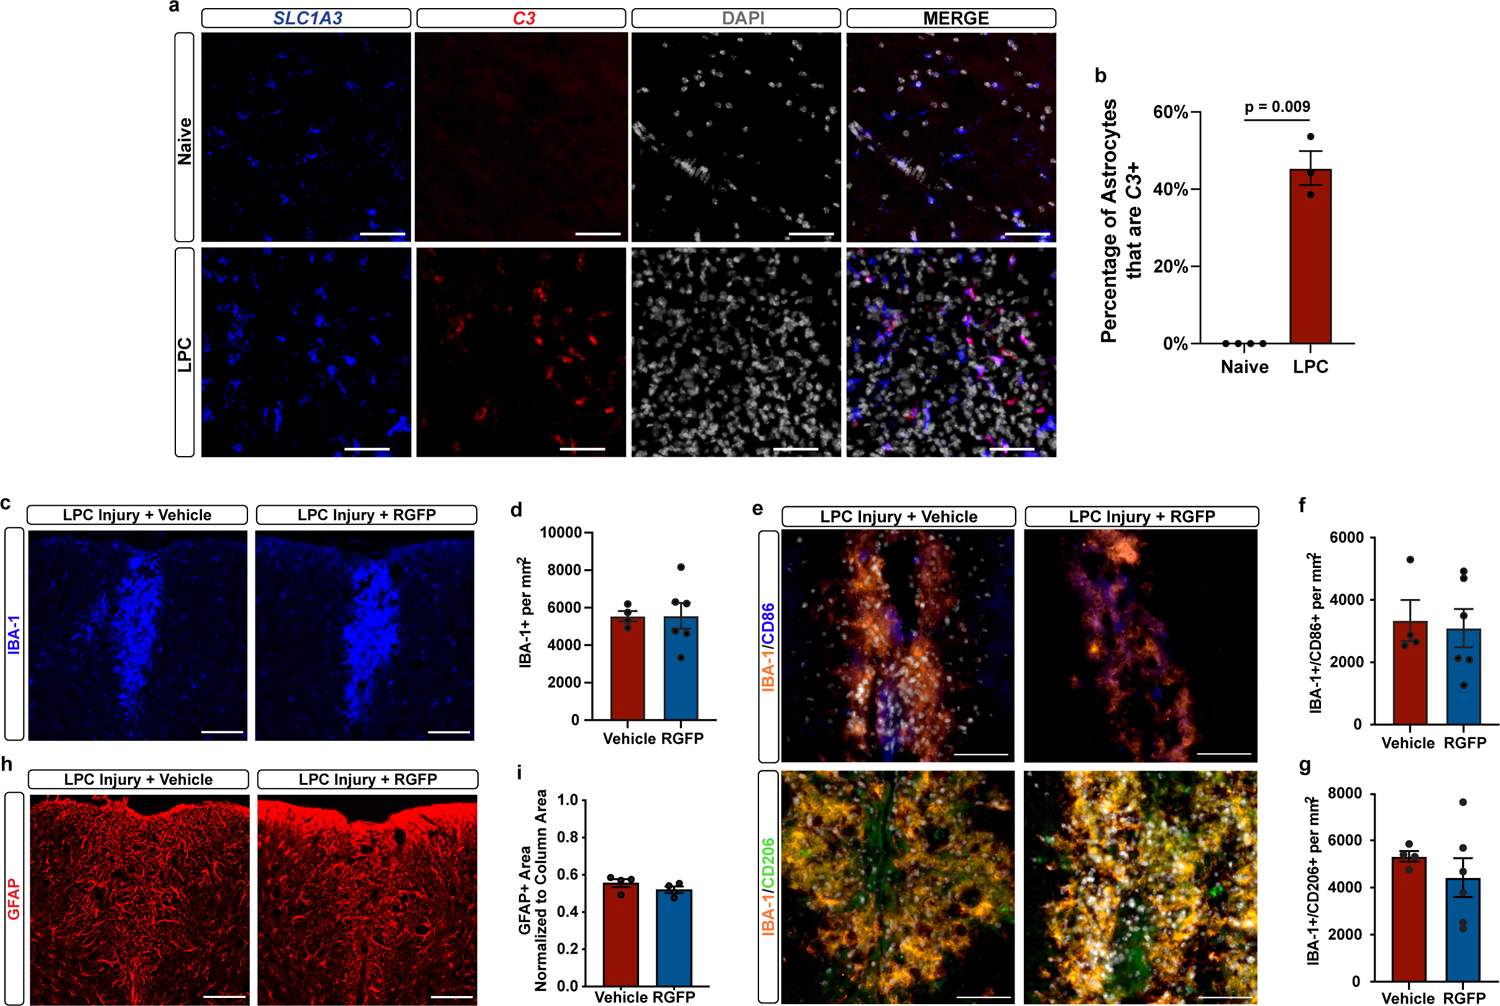
a-b, Representative in situ hybridization images and quantification of naïve and LPC lesioned mice probed for the pan-astrocyte marker Slc1a3 (blue) and the reactive astrocyte marker C3 (red). Scale bar is 50um. Data are mean± s.e.m., n = 3 or 4 biological replicates (mice), p-value by unpaired two-tailed t-test. c-d, Representative images, and quantification of LPC lesions from vehicle or RGFP966 (RGFP) treated mice stained for IBA-1. Scale bar is 100um. Data are mean ± s.e.m., n = 4 biological replicates (mice). e-g, Representative images, and quantification of LPC lesions from RGFP966 or vehicle treated mice stained for IBA-1 (orange), CD86 (blue), and CD206 (green). Scale bar is 100um. Data are mean ± s.e.m., n = 4 or 6 biological replicates (mice). h-i, Representative images, and quantification of LPC lesion from vehicle or RGFP treated mice stained for GFAP. Scale bar is 100um. Data are mean ± s.e.m., n = 4 biological replicates (mice).