
Extended Data Figure 1. Purity and function of astrocyte cultures.
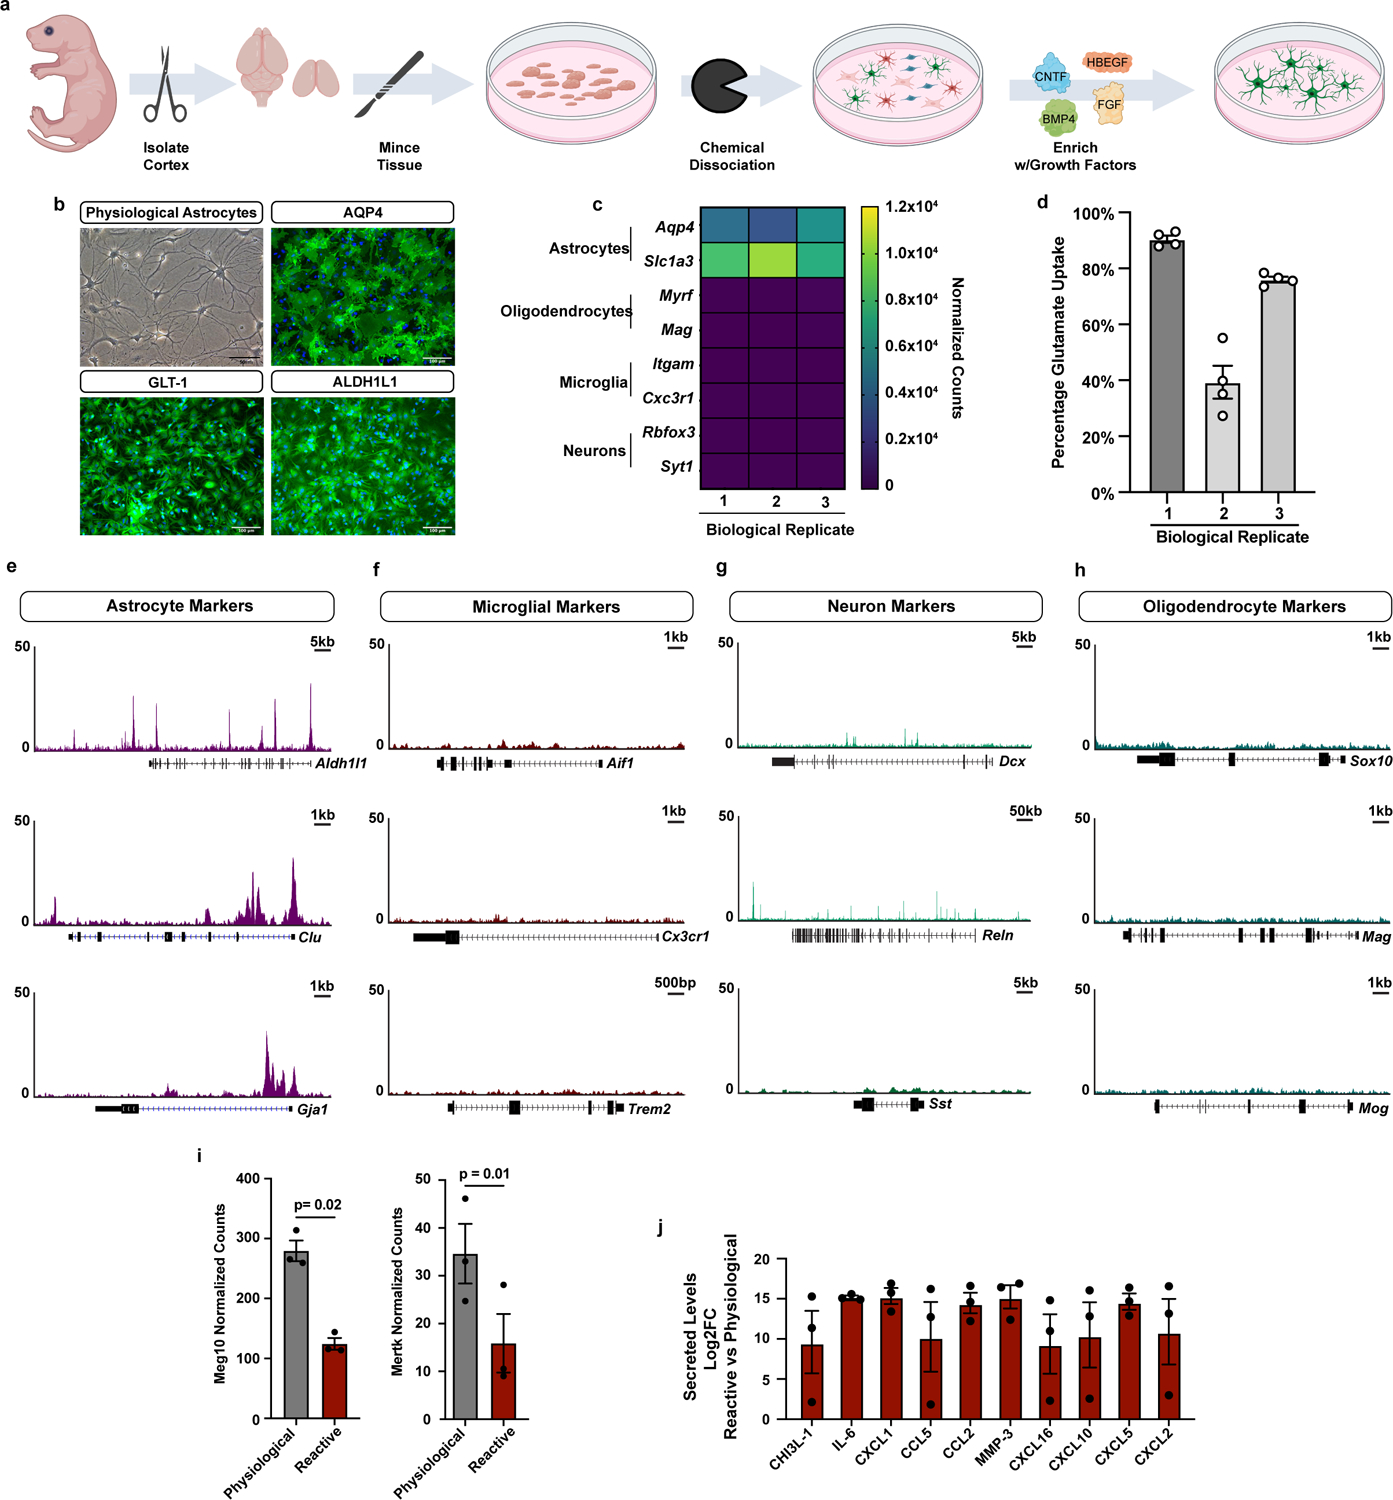
a, Overview diagram of astrocyte isolation and enrichment protocol (images generated by BioRender). b, Phase contrast image showing prototypical astrocyte morphology from a single astrocyte culture. Scale bar is 50um. Immunofluorescence images showing expression of canonical astrocyte markers AQP4, GLT-1 (SLC1A2), and ALDH1L1 in a single astrocyte culture. Scale bar is 100um. c, Bulk RNAseq data showing high expression of astrocyte marker genes and no expression of marker genes for other CNS cell types. Data are from 3 biological replicates (independent astrocyte isolations). d, Glutamate uptake by physiological astrocytes in culture. Data presented as the mean ± s.e.m. for technical replicates (open circles) from 3 biological replicates (independent astrocyte isolations).e-h, ATACseq tracks at marker genes for CNS cell types. Chromatin is only open at astrocyte genes. i, Bulk RNAseq data showing decreased expression of Meg10 and Mertk in agreement with decreased phagocytosis of myelin debris by reactive astrocytes. Data presented as mean ± s.e.m. for n = 3 biological replicates. p-value generated by paired two-tailed t-test. j, The Log2 fold-change (Log2FC) of secreted cytokines in reactive vs physiological astrocytes conditioned media. Data presented as mean ± s.e.m for n = 3 biological replicates.