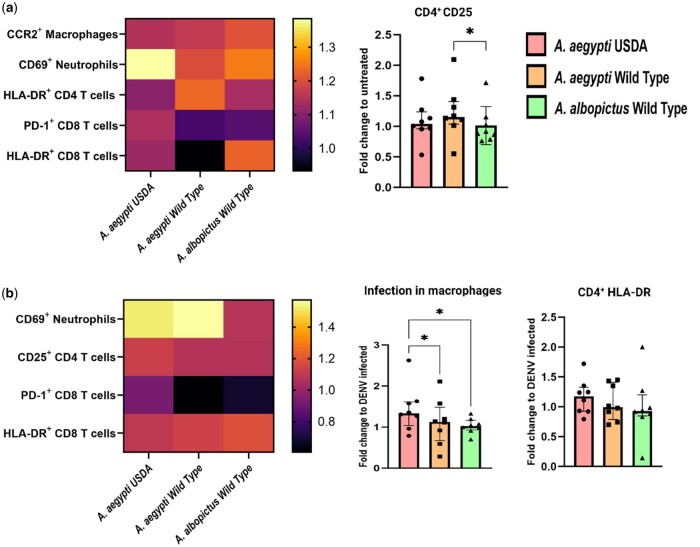
Figure 3.
Comparative analysis of the fold change in activation markers elicited by the different SGEs. Additional analysis of the data obtained in Figs 1 and 2, showing the fold change of differences comparing the three mosquito groups between them. (a) Left panel: Heat map of fold change in marker expression after SGE exposure. Right panel: Higher fold change of CD4+ T cells expressing CD25 in conditions treated with Ae. aegypti WT when compared to Ae. albopictus WT. (b) Left panel: Heat map of fold change in marker expression after SGE and DENV exposure. Right panel: Increase in the fold change of infected macrophages (CD45+ CD11b+CD14+) when comparing Ae. aegypti USDA and WT SGEs. Statistical analysis were performed Friedman + Dunn’s multiple comparisons test, two tailed. Bars indicate median and interquartile range. Gray: unstimulated condition, Red: SGE from Ae. aegypti USDA strain, Yellow: SGE from Ae. aegypti WT strain, Green: SGE from Ae. albopictus WT strain. N = 8 individuals. *P < 0.05.

