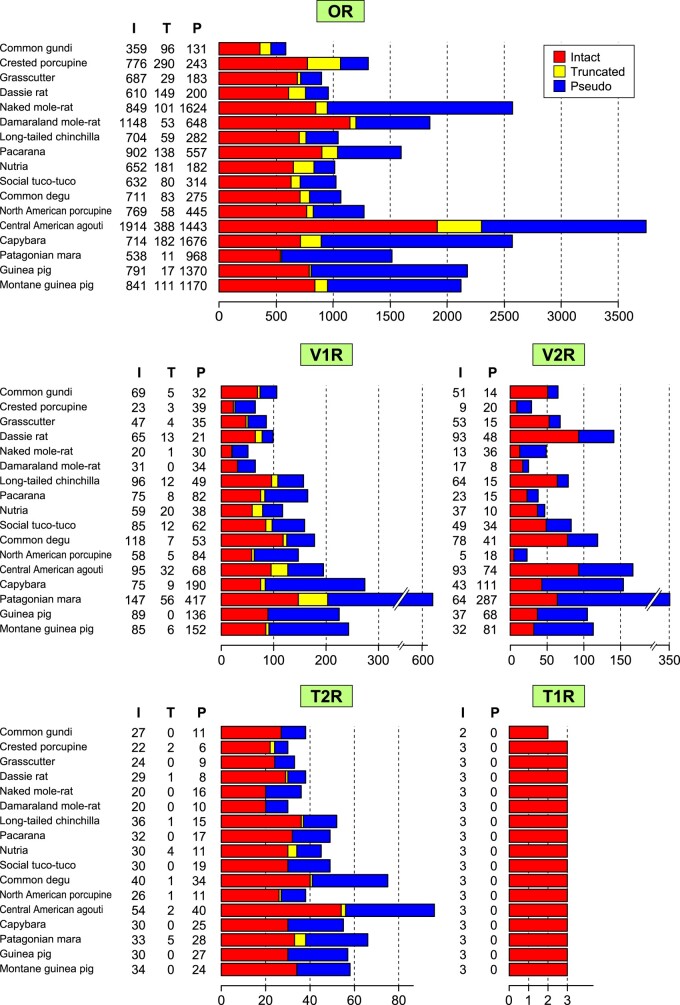
Fig. 2.
Number of OR, V1R, V2R, T1R, and T2R genes in 17 Hystricomorpha species. In the histograms for OR, V1R, and T2R genes, left, middle, and right bars indicate the number of intact genes (I), truncated genes (T), and pseudogenes (P), respectively, for each species. For V2R and T1R genes, the number of intact exon 3 sequences (I) and pseudogenes (P) is displayed.

