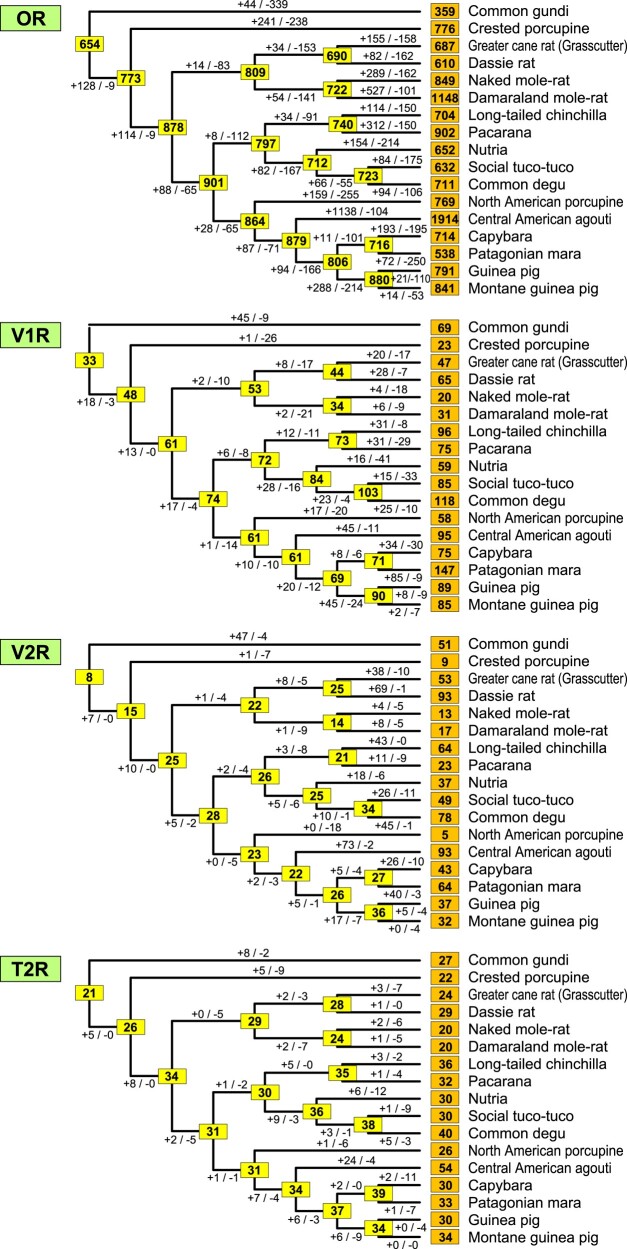
Fig. 5.
Gains and losses of OR, V1R, V2R, and T2R genes during Hystricomorpha evolution. The boxes on external and internal nodes represent the number of intact genes in each extant species and estimates of functional genes in the ancestral species, respectively. Additionally, it displays the estimated numbers of gene gains and losses in each branch of the Hystricomorpha phylogenetic tree.

