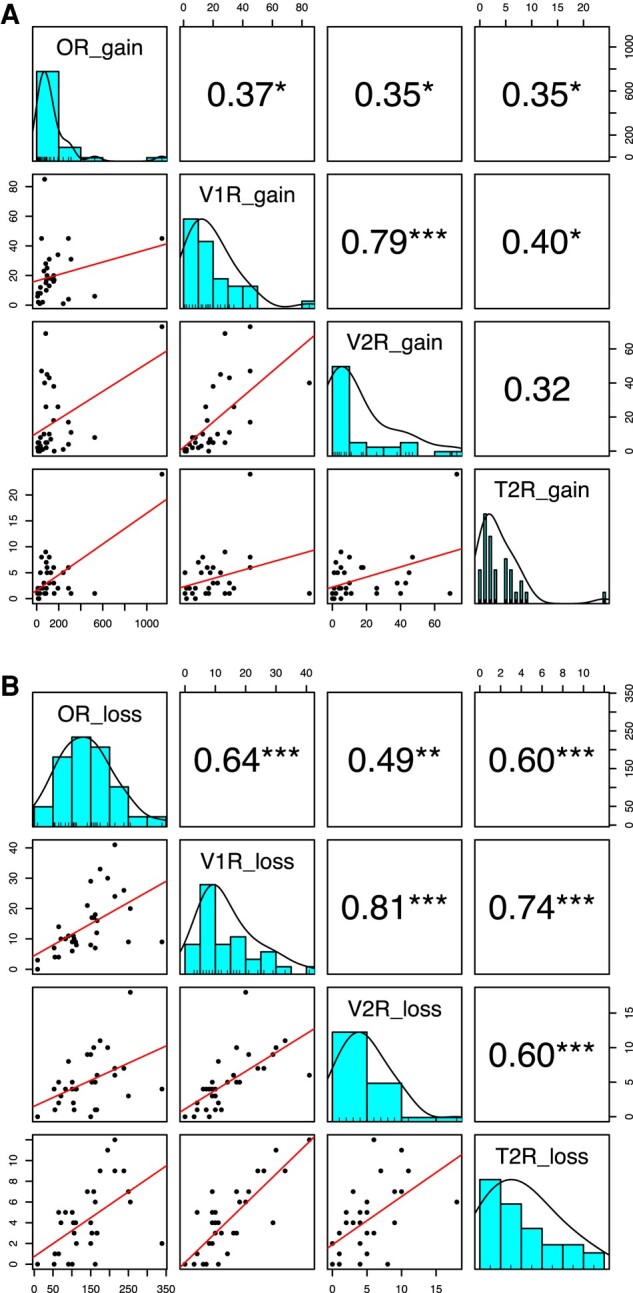
Fig. 6.

Correlation in the numbers of gene gains (a) and gene losses (b) per branch of the Hystricomorpha evolution among OR, V1R, V2R, and T2R genes. The histograms within squares on a diagonal line represent the distribution of the numbers of gene gains (a) or losses (b). The numbers within squares at the top right display Spearman's rank correlation coefficient. *P < 5%; **P < 1%; ***P < 0.1%. The graphs within squares at the bottom left indicate the scatterplot with a regression line.
