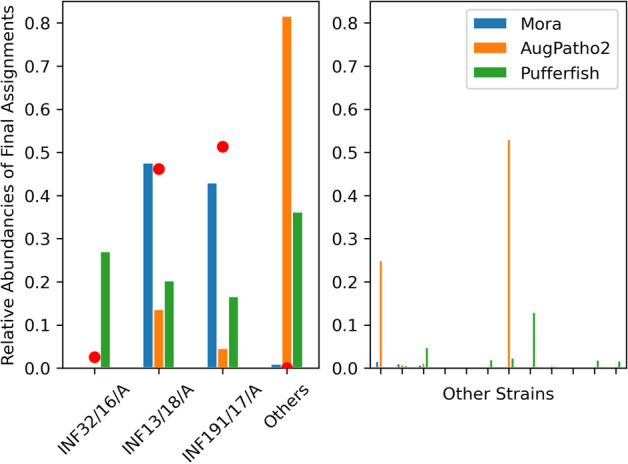
Fig. 4.

Comparison of assignment percentages of real short E. coli reads from the three assemblies: INF32/16/A, INF13/18/A, and INF191/17/A by Mora, AugPatho2, and the initial aligner Pufferfish. The real abundance levels of the strains are represented by the red dots. The left subfigure shows the real abundances as red dots, which are at 2.5% 46.18%, and 51.20% respectively. This highlights that Mora has the smallest error. Mora assigns 3% of reads to INF32/16/A while AugPatho2 assigns 1% of reads to it. The right subfigure shows 10 of the other strains that had the highest assignments from Mora. AugPatho2 and Pufferfish assigns a lot of reads to a wrong strain
