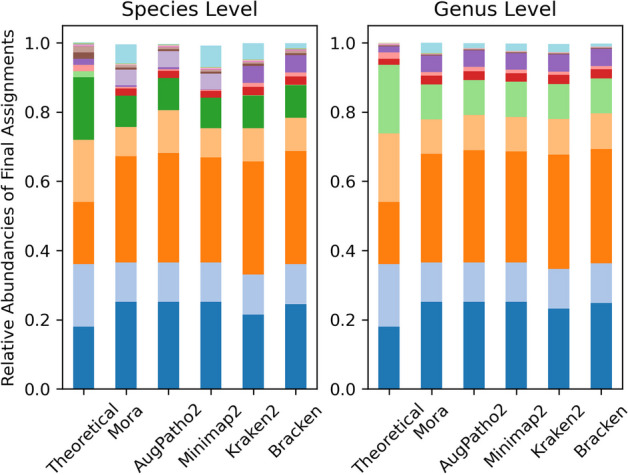
Fig. 5.

Species and genus abundance based on final read assignments of 5 different algorithms on the ATCC MSA-1003 mock community. Different coloured blocks in each column represent a different species/genus. The sub-figure on the left shows 24 of the most abundant species detected by the algorithms, with the light blue block at the top representing the other species. The sub-figure on the right shows the 18 genera that theoretically make up the mock community, with the blue block at the top of the columns representing the other genera. The initial aligner for Mora and AugPatho2 was Minimap2 after performing a pruning step of low quality reads with MAPQ score less than 5. Assignments for Minimap2 were done by picking the primary strain
