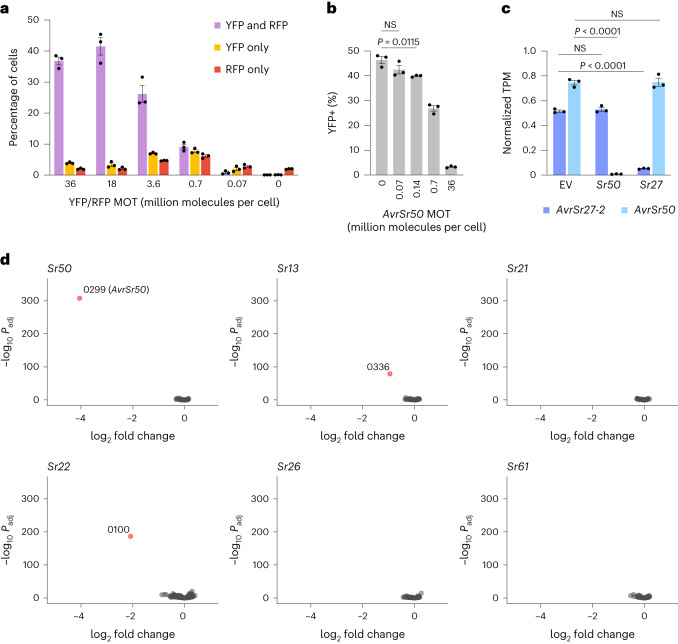
Fig. 2. Optimization and validation of pooled effector library screening for rapid identification of interacting R–Avr pairs.
a, Wheat protoplasts were transformed with YFP and RFP reporter constructs at various MOTs (million plasmid molecules per cell) along with an empty vector whose amount was varied such that the combined MOT of the three constructs remained constant at 72 million plasmid molecules per cell. The percentage of cells showing fluorescence in the YFP, RFP or both wavelengths was determined by flow cytometry. Mean ± s.e.m. of 3 biological replicates. b, Wheat protoplasts were co-transformed with YFP, Sr50 and one of a series of mock libraries comprising AvrSr50 at various MOTs within a background of AvrSr35 (combined MOT of 36 million plasmid molecules per cell for the two constructs). Plot shows the percentage of YFP-positive living cells determined by flow cytometry. Mean ± s.e.m. of 3 biological replicates (dots), with relevant significant differences indicated (NS, not significant; two-tailed unpaired t-test assuming equal variances). c, Expression levels of AvrSr27-2 and AvrSr50 in a mock effector library screen. Wheat protoplasts were co-transformed with a mock library consisting of AvrSr50 (MOT of 0.14 million plasmid molecules per cell) and AvrSr27-2 (MOT of 0.14 million plasmid molecules per cell) within a background of AvrSr35 (MOT of 100 million plasmid molecules per cell) and either Sr50, Sr27 or an empty vector (MOT of 36 million plasmid molecules per cell). Relative expression levels of AvrSr27-2 and AvrSr50 were determined by targeted RNA-seq (shown in transcripts per million (TPM), normalized to AvrSr35 expression). Mean ± s.e.m. of 3 replicates, with significant differences indicated (two-tailed unpaired t-test assuming equal variances). d, Differential gene expression analysis of a pooled stem rust effector library comprising 696 predicted effectors co-transformed into wheat protoplasts with the R genes Sr50, Sr13c, Sr21, Sr22, Sr26 or Sr61 compared to the empty vector. Graphs show volcano plots of differential expression (x axis) versus Padj (y axis) for each effector construct (dots). Effector gene constructs showing significantly reduced expression (red dots) within each treatment are labelled with their library ID number.

