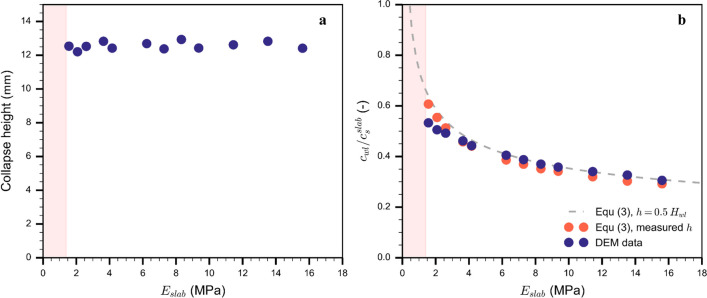
Fig. 11.
(a) Collapse height as function of slab elastic modulus: DEM data shown by full circles. (b) Normalized steady-state crack speed as function of slab elastic modulus: DEM data shown by dark blue full circles. The dashed grey line shows the semi-empirical model assuming a collapse height of 50% of the weak layer thickness (1 cm). Orange circles shows speed obtained with the semi-empirical model with the collapse height as obtained in the DEM simulation and shown in (a)

