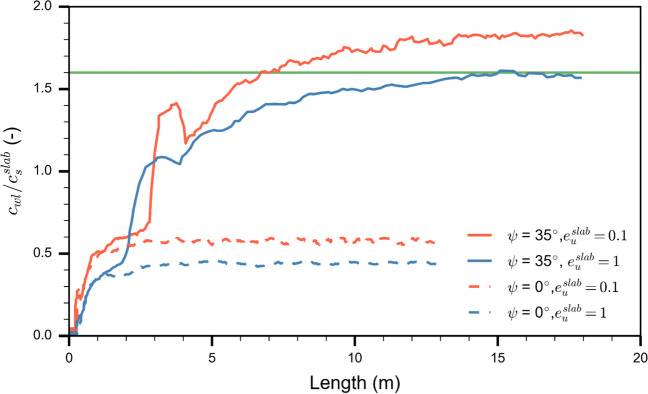
Fig. 12.
Normalized crack speed along the PST column for different slope angles (). The dashed line shows the crack speed evolution for a PST in flat terrain (= 0°) and the solid line for a tilted PST (= 35°). Orange lines correspond to a restitution coefficient equal to 0.1, i.e., weak layer and slab particles are damped. Blue lines correspond to a slab restitution coefficient equal to 1.0, i.e. no damping applied for slab particles, for weak layer particles)

