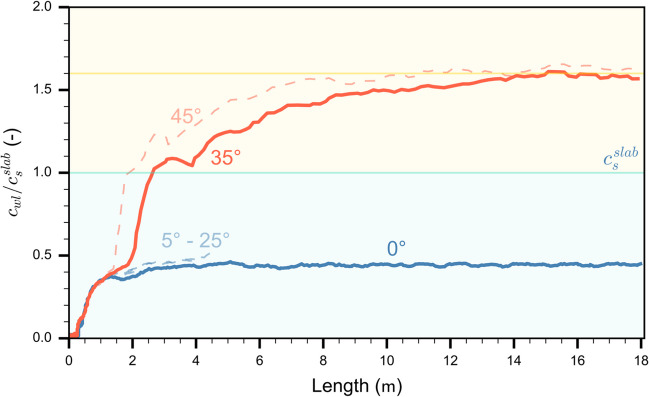
Fig. 6.
Normalized crack speed along the PST column for different slope angles (). The blue line shows the crack speed evolution for a PST in flat terrain (= 0°), the orange line that for a tilted PST (= 35°). The dashed light blue lines correspond to the tilted PSTs with slope angles between 5 and 25°; the dashed light orange lines correspond to tilted PSTs with slope angle 45°. The blue background corresponds to the range of sub-Rayleigh crack speed (), the yellow background to the range of supershear crack speed (). The yellow line represents 1.6

