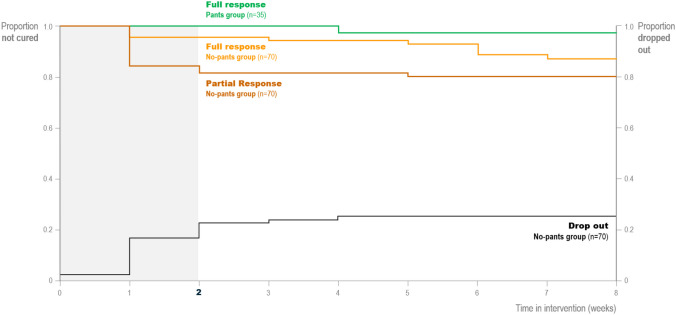
Fig. 3.
The different trajectories depict the number of full (orange) and partial (brown) responders in the no pants and the full responders (green) in the pants group. The x-axis represents the time in weeks. The y-axis to the left shows the proportion of children not cured. The black trajectory depicts the dropout rate, and the y-axis to the right shows the proportion of children who dropped out. Assessments of status were done at the end of each week. If all seven nights in a week were dry, then the child was a full responder for that week; if they had ≥ four dry nights, the child was a partial responder; and if they left the study, they were a dropout

