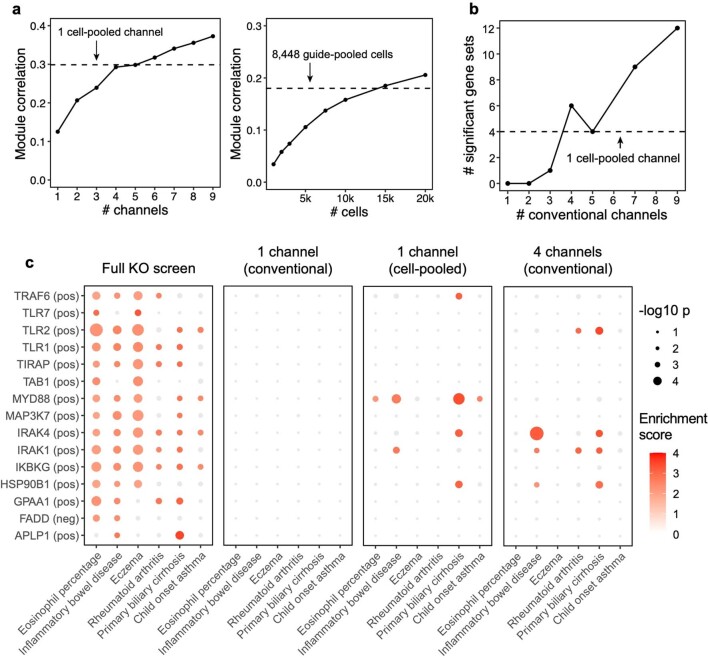
Extended Data Fig. 4. Additional analyses comparing compressed versus conventional screens.
(a) Same as Fig. 3e (left) and 4e (right), but correlation (Y-axis) is computed based on perturbation effects on gene modules rather than effects on individual genes. FR-Perturb produces module dictionaries that are correlated but not identical when applied to different datasets, which precludes the direct comparison of perturbation effects on modules in different datasets. Thus, to enable this comparison, the module dictionary was fixed to be the one obtained from the held-out validation dataset for all results above. We note that overall lower correlation is observed in this figure than Figs. 3e and 4e because we compared all perturbation’s effects on all modules rather than only significant effects on genes. (b) Same as Fig. 3e, but performance is assessed based on the number of gene sets constructed from the perturbation effects with significant GWAS heritability enrichment estimated using sc-linker (p < 0.001 for at least two traits out of 63 total; same threshold used as Fig. 6a; see Methods and section ‘Integrating Perturb-seq with genome-wide association studies’ in the main text). P-values are two-sided and obtained from sc-linker. (c) Individual heritability enrichment estimates for all significant gene sets and traits from the full knock-out screen (combined cell-pooled and conventional screens, leftmost plot). The same effects are shown for gene sets constructed from perturbation effects estimated from 1 conventional channel, 1 cell-pooled channel, and 4 conventional channels. Effects with p > 0.001 are greyed out.

