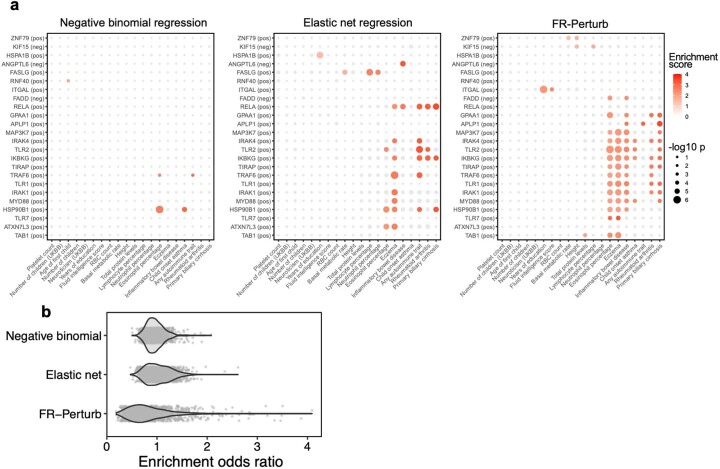
Extended Data Fig. 5. Additional analyses comparing inference methods.
(a) Heritability enrichment estimates and p-values (estimated using sc-linker; Methods) for gene sets and traits that are significant in at least one of the three inference methods. Gene sets were constructed in the same manner as in Fig. 6a (see section ‘Integrating Perturb-seq with genome-wide association studies’ in the main text). Significance is determined as having two or more effects with p < 0.001 (same threshold used as in Fig. 6a). Greyed out points correspond to p-value > 0.001. Gene sets are constructed from the conventional knock-out screen. (b) Odds ratios for enrichment of evolutionarily constrained genes (pLI > 0.9) in all gene sets (comprising the top 500 upregulated or downregulated genes from each perturbation) estimated from the three inference methods. Each point represents a gene set.

