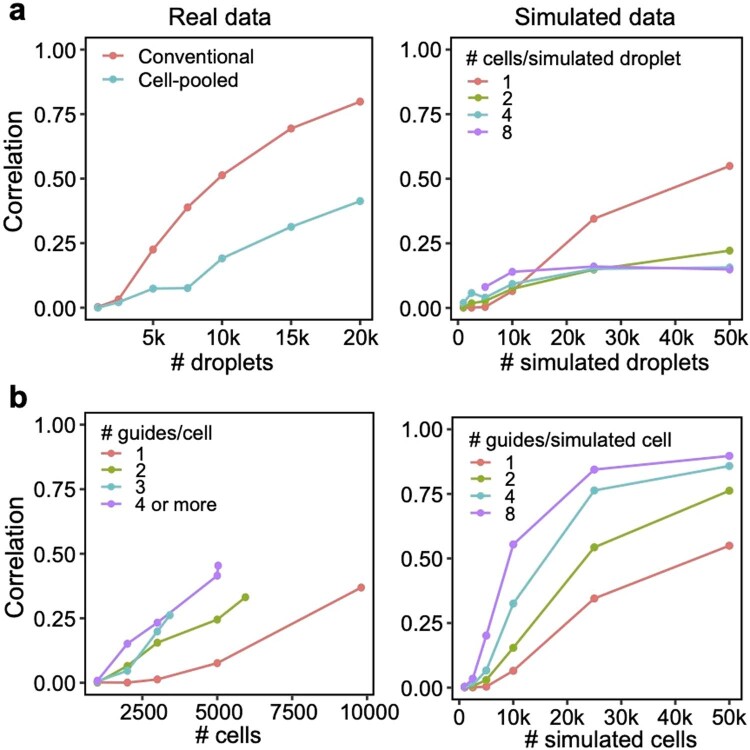
Extended Data Fig. 6. Relationship between degree of overloading and performance.
(a) Down-sampling droplets from cell-pooled and conventional screens. (Left) Correlation of top 10,000 estimated effects with held-out validation data (y-axis) when varying droplet count (x-axis). (Right) Correlation of top 10,000 estimated effects with true effects in simulations of cell-pooled data with varying numbers of cells/droplet. (b) Down-sampling cells from guide-pooled screen stratified by # guides/cell. (Left) Correlation of top 10,000 estimated effects with held-out validation data (y-axis) when varying cell count (x-axis). (Right) Correlation of top 10,000 estimated effects with true effects in simulations of guide-pooled data.

