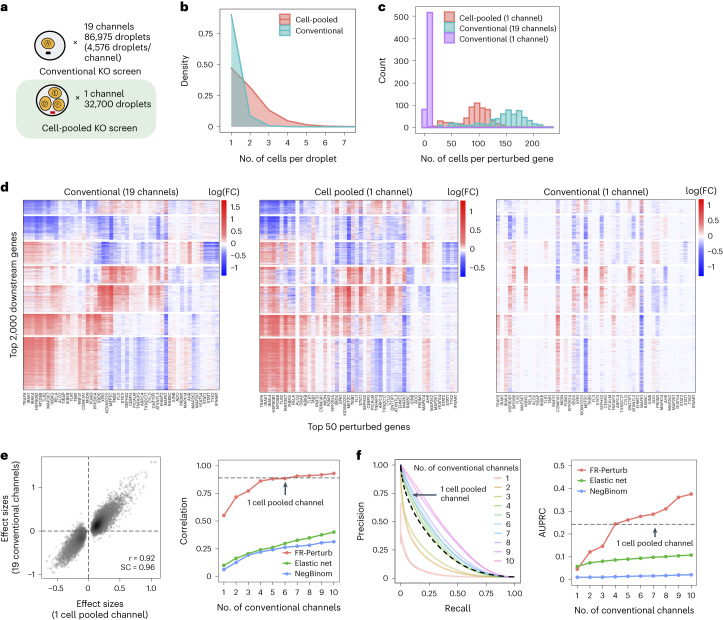
Fig. 3. Evaluating cell-pooled Perturb-seq versus conventional Perturb-seq.
a, Number of channels and droplets from the conventional validation screen (top) and the cell-pooled screen (bottom). b, Distribution of droplets based on the number of cells they contain for the cell-pooled and conventional screens. c, Distribution of the number of cells containing a guide targeting each perturbed gene in the cell-pooled screen and conventional screen (19 channels = full screen, 1 channel = matching number of channels from cell-pooled screen). d, Heat maps of the top effect sizes (inferred with FR-Perturb) from the conventional screen (left), with the same effect sizes shown for the cell-pooled screen (middle) and one equivalent channel of the conventional screen (right). x axis: top 50 perturbed genes, based on their average magnitude of effect on all 17,552 downstream genes. y axis: top 2,000 downstream genes, based on the average magnitude of effects of all 598 perturbed genes acting on them. Rows and columns are clustered based on hierarchical clustering in the leftmost plot. For the left plot, all effects with FDR q > 0.2 are whited out (q value threshold relaxed to 0.5 for the middle and right plots). e, Left, scatter plot of all significant effects (q < 0.05; n = 19,909) from the cell-pooled screen (x axis) versus the same effects in the conventional screen (y axis). Effects represent log fold changes in expression relative to control cells. r, Pearson’s correlation coefficient; SC, sign concordance. Right, held-out validation accuracy of top 19,909 effects (y axis; Pearson’s correlation with validation dataset) from the downsampled conventional screen (x axis) and the cell-pooled screen (dotted line). The same inference method is used to estimate effects in both the downsampled conventional data and validation data. The effects from the cell-pooled screen are estimated using FR-Perturb only (see Extended Data Fig. 3d for results using other methods). f, Left, precision-recall curves computed from downsampled conventional screen and cell-pooled screen (dotted line). True positives = all significant effects (n = 79,100) from the held-out validation dataset. The classification threshold being varied (x axis) is the significance (that is, P value) of the effects. All effects displayed are learned using FR-Perturb. Right, AUPRCs (y axis) computed from the downsampled conventional experiment when varying the number of channels (x axis). FC, fold change.

