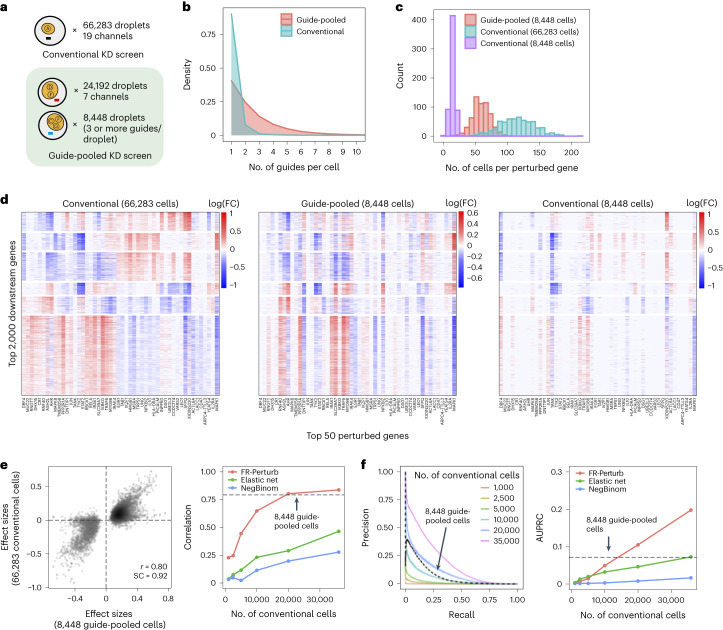
Fig. 4. Evaluating guide-pooled Perturb-seq versus conventional Perturb-seq.
a, Number of channels and droplets from the conventional validation screen (top) and the guide-pooled screen (bottom). We focused our analysis on the subset of 8,448 droplets from the guide-pooled screen with at least three guides per droplet. b, Distribution of cells based on the number of guides that they contain for the full guide-pooled and conventional screens. In practice, we only directly measured the number of guides per droplet rather than guides per cell, but these quantities are equivalent given one cell per droplet. c–f, See captions for Fig. 3c–f. These analyses were conducted in an identical fashion, with the only difference being that the screens are downsampled based on cell count rather than channel count. FC, fold change.

