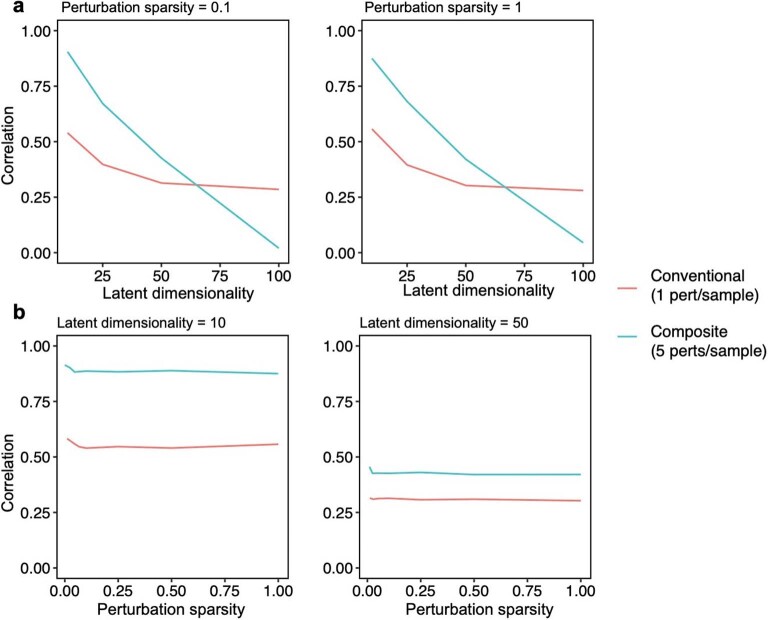
Extended Data Fig. 1. Performance of compressed Perturb-seq in simulations with different effect size structure.
Effect sizes were simulated for 100 perturbations on 10,000 genes by separately simulating factor matrices, comprising a (1) 100 perturbation x module ‘activity’ matrix and (2) module x 10,000 gene ‘dictionary’ matrix, then multiplying the matrices together to obtain the final effect size matrix. Entries for both factor matrices were drawn from N(0, 1). The latent dimensionality (corresponding to r in the main text) of the final matrix was set by varying the number of modules (that is columns of the activity matrix or rows of the dictionary matrix). The perturbation sparsity (corresponding to q in the main text) was set by randomly setting a given proportion of entries in the module activity matrix to zero. Samples were generated by taking random rows (or sums of random combinations of rows) of the perturbation-by-gene effect size matrix, with the number of rows represented per sample set to 1 for conventional samples or 5 for composite samples. Noise from N(0, 9) was added to all samples to generate phenotypes with 10% signal and 90% noise for the 1 perturbation/sample scenario (plausible for single-cell expression data). Unless otherwise specified, inference was performed using the Factorize-Recover algorithm. (a) Correlation of inferred vs. true effects (Y-axis) when varying the latent dimensionality r of the perturbation effect size matrix (X-axis). q was fixed at 0.1 (left) or 1 (right). (b) Correlation of inferred vs. true effects (Y-axis) when varying the perturbation sparsity q (that is the proportion of nonzero entries in the module activity matrix; X-axis). r was fixed at 10 (left) or 50 (right).

