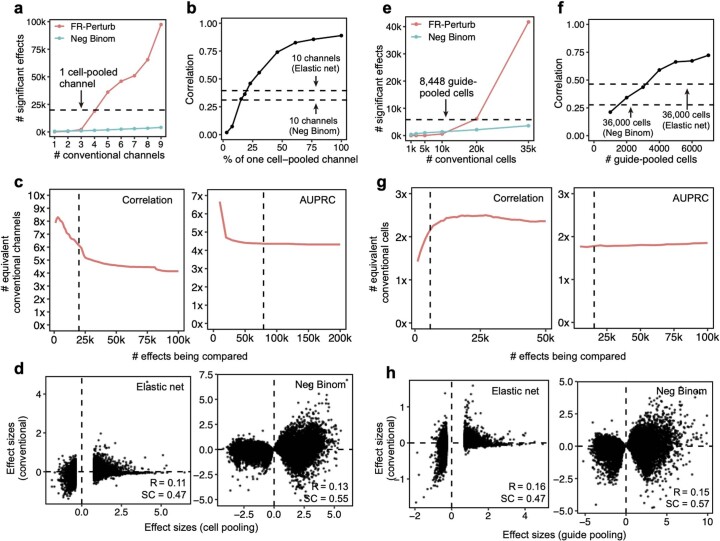
Extended Data Fig. 3. Additional analyses comparing compressed versus conventional screens.
(a) Number of significant effects (q < 0.05) detected by FR-Perturb and negative binomial regression (y-axis) as a function of number of channels (x-axis) from the conventional knock-out screen. We do not include the number of significant effects from elastic net due to its extremely large magnitude ( > 1,000,000), which is inconsistent with the performance of elastic net in held-out validation analyses. (b) Sample size in terms of percentage of a single cell-pooled channel by droplet count (x-axis) versus out-of-sample validation accuracy (y-axis). Validation accuracy of 10 channels analyzed with elastic net or negative binomial regression is indicated with dotted lines. (c) Performance of cell-pooled versus conventional screen (y-axis) while varying the number of effects being compared (x-axis). Performance is quantified as the number of conventional channels needed to obtain the same correlation (left) or AUPRC (right) as one cell-pooled channel. Dotted line represents the cutoffs used in Fig. 3e, f. (d) Scatterplots of top 19,909 estimated effects from the cell-pooled screen (x-axis) versus the same effects in the conventional screen (y-axis) when estimating effects using elastic net regression (left) or negative binomial regression (right). R = Pearson’s correlation, SC = sign concordance. (e-h) Same as a-d, but showing results from the guide-pooled screen (restricting to cells with 3 or more guides) and corresponding conventional screen.

