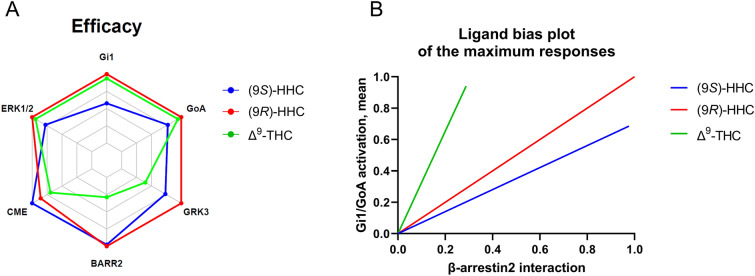
Figure 6.
Pharmacological profiles of (9S)-HHC, (9R)-HHC, and Δ9-THC. (A) Calculated maximum response values or the time-course peaks were plotted on the axes of the radar plot. For clathrin-mediated internalization (CME), the 60 min time points were used; for ERK1/2 phosphorylation, the 10 min time points were used. (B) Calculated maximum response values of the tested cannabinoids were represented as fractions of WIN and normalized to (9R)-HHC. The normalized values for β-arrestin interaction were plotted on the x-axis, and the means of the normalized values for Gi1/GoA activation were plotted on the y-axis. The values represent only the maximum responses elicited by the ligands.

