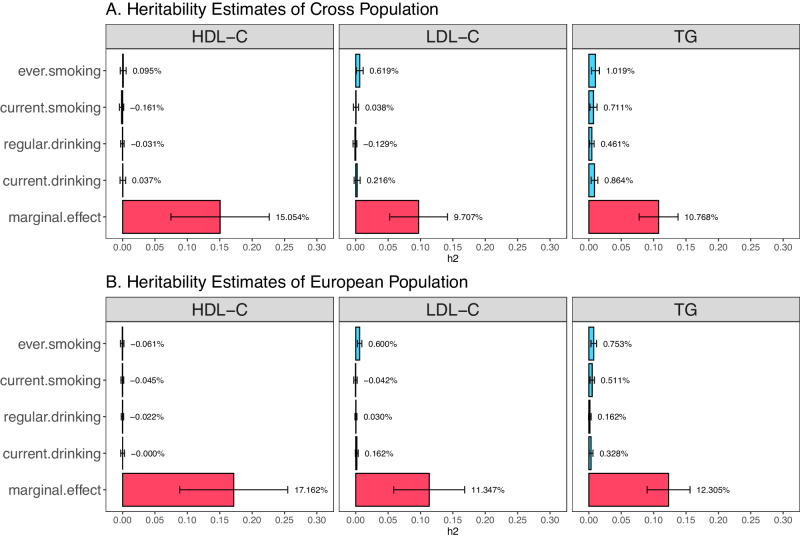
Fig. 4. The estimated heritability of HDL-C, LDL-C, and TG using LDSC regression.
A Cross-Population. B European population. X-axis represents heritability in percentage. Y-axis represents the corresponding heritability estimated in percentage (marginal.effect: marginal effect heritability; current.drinking: gene and current drinking interaction effect heritability; regular.drinking: gene and regular drinking interaction effect heritability; current.smoking: gene and current smoking interaction effect heritability; ever.smoking: gene and ever smoking interaction effect heritability). Marginal effect heritability refers to the heritability estimated through the marginal effect , and interaction effect heritability refers to the heritability estimated through . The percentage number displayed on the right side of each bar represents the estimated heritability, and the corresponding 95% confidence interval shown as horizontal error bars. For the marginal effect analysis, the sample size is 1.65 M and 1.32 M for cross-population and European population analysis, respectively. For the interaction effect analysis, the sample size is 134 K and 80 K for cross-population and European population analysis, respectively.

