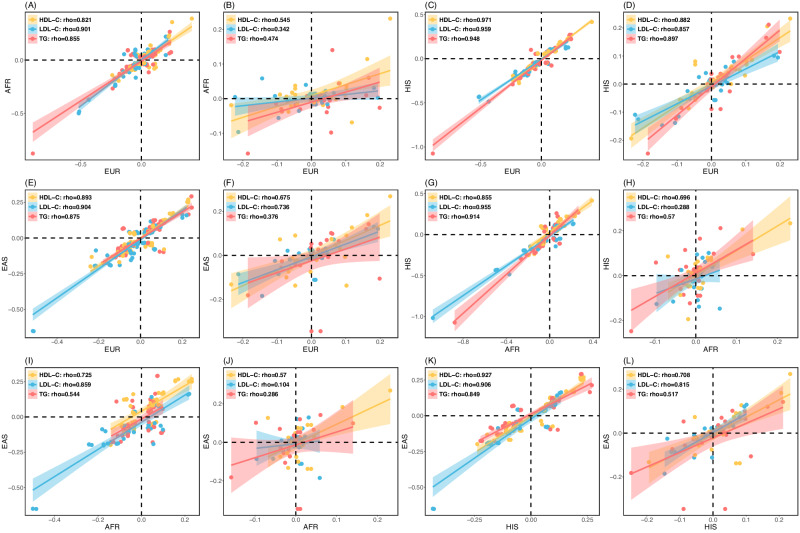
Fig. 5. Cross-population comparison of the LDL-C, HDL-C, and TG marginal effect sizes of the variants reported in Graham et al.3.
A EUR vs AFR, no interaction or mediation. B EUR vs AFR, interaction or mediation. C EUR vs HIS, no interaction or mediation. D EUR vs HIS, interaction or mediation. E EUR vs EAS, no interaction or mediation. F EUR vs EAS, interaction or mediation. G AFR vs HIS, no interaction or mediation. H AFR vs HIS, interaction or mediation. I AFR vs EAS, no interaction or mediation. J AFR vs EAS, interaction or mediation. K HIS vs EAS, no interaction or mediation. L HIS vs EAS, interaction or mediation. The variants with no interaction or mediation are those not included in Supplementary Data S3a. The variants with interaction or mediation are those in Supplementary Data S3a. We only included independent variants. The shadow error bands represent the 95% confidence intervals. Clearly the variants without interactions or mediations have substantially larger cross-population correlations than the variants with interactions or mediations, suggesting that interactions or mediations contribute the marginal effect size heterogeneity across populations. (European (EUR), African (AFR), Hispanics (HIS), Eastern Asian (EAS)).

